EP0895084A2 - Device and method for obtaining clinically significant analyte ratios - Google Patents
Device and method for obtaining clinically significant analyte ratios Download PDFInfo
- Publication number
- EP0895084A2 EP0895084A2 EP98112964A EP98112964A EP0895084A2 EP 0895084 A2 EP0895084 A2 EP 0895084A2 EP 98112964 A EP98112964 A EP 98112964A EP 98112964 A EP98112964 A EP 98112964A EP 0895084 A2 EP0895084 A2 EP 0895084A2
- Authority
- EP
- European Patent Office
- Prior art keywords
- analyte
- region
- binding partner
- concentration
- band
- Prior art date
- Legal status (The legal status is an assumption and is not a legal conclusion. Google has not performed a legal analysis and makes no representation as to the accuracy of the status listed.)
- Granted
Links
Images
Classifications
-
- G—PHYSICS
- G01—MEASURING; TESTING
- G01N—INVESTIGATING OR ANALYSING MATERIALS BY DETERMINING THEIR CHEMICAL OR PHYSICAL PROPERTIES
- G01N33/00—Investigating or analysing materials by specific methods not covered by groups G01N1/00 - G01N31/00
- G01N33/48—Biological material, e.g. blood, urine; Haemocytometers
- G01N33/50—Chemical analysis of biological material, e.g. blood, urine; Testing involving biospecific ligand binding methods; Immunological testing
- G01N33/53—Immunoassay; Biospecific binding assay; Materials therefor
- G01N33/543—Immunoassay; Biospecific binding assay; Materials therefor with an insoluble carrier for immobilising immunochemicals
- G01N33/54366—Apparatus specially adapted for solid-phase testing
- G01N33/54386—Analytical elements
- G01N33/54387—Immunochromatographic test strips
- G01N33/54388—Immunochromatographic test strips based on lateral flow
-
- G—PHYSICS
- G01—MEASURING; TESTING
- G01N—INVESTIGATING OR ANALYSING MATERIALS BY DETERMINING THEIR CHEMICAL OR PHYSICAL PROPERTIES
- G01N33/00—Investigating or analysing materials by specific methods not covered by groups G01N1/00 - G01N31/00
- G01N33/48—Biological material, e.g. blood, urine; Haemocytometers
- G01N33/50—Chemical analysis of biological material, e.g. blood, urine; Testing involving biospecific ligand binding methods; Immunological testing
- G01N33/53—Immunoassay; Biospecific binding assay; Materials therefor
- G01N33/558—Immunoassay; Biospecific binding assay; Materials therefor using diffusion or migration of antigen or antibody
-
- Y—GENERAL TAGGING OF NEW TECHNOLOGICAL DEVELOPMENTS; GENERAL TAGGING OF CROSS-SECTIONAL TECHNOLOGIES SPANNING OVER SEVERAL SECTIONS OF THE IPC; TECHNICAL SUBJECTS COVERED BY FORMER USPC CROSS-REFERENCE ART COLLECTIONS [XRACs] AND DIGESTS
- Y10—TECHNICAL SUBJECTS COVERED BY FORMER USPC
- Y10S—TECHNICAL SUBJECTS COVERED BY FORMER USPC CROSS-REFERENCE ART COLLECTIONS [XRACs] AND DIGESTS
- Y10S435/00—Chemistry: molecular biology and microbiology
- Y10S435/973—Simultaneous determination of more than one analyte
-
- Y—GENERAL TAGGING OF NEW TECHNOLOGICAL DEVELOPMENTS; GENERAL TAGGING OF CROSS-SECTIONAL TECHNOLOGIES SPANNING OVER SEVERAL SECTIONS OF THE IPC; TECHNICAL SUBJECTS COVERED BY FORMER USPC CROSS-REFERENCE ART COLLECTIONS [XRACs] AND DIGESTS
- Y10—TECHNICAL SUBJECTS COVERED BY FORMER USPC
- Y10S—TECHNICAL SUBJECTS COVERED BY FORMER USPC CROSS-REFERENCE ART COLLECTIONS [XRACs] AND DIGESTS
- Y10S436/00—Chemistry: analytical and immunological testing
- Y10S436/909—Nephelometry
-
- Y—GENERAL TAGGING OF NEW TECHNOLOGICAL DEVELOPMENTS; GENERAL TAGGING OF CROSS-SECTIONAL TECHNOLOGIES SPANNING OVER SEVERAL SECTIONS OF THE IPC; TECHNICAL SUBJECTS COVERED BY FORMER USPC CROSS-REFERENCE ART COLLECTIONS [XRACs] AND DIGESTS
- Y10—TECHNICAL SUBJECTS COVERED BY FORMER USPC
- Y10T—TECHNICAL SUBJECTS COVERED BY FORMER US CLASSIFICATION
- Y10T436/00—Chemistry: analytical and immunological testing
- Y10T436/14—Heterocyclic carbon compound [i.e., O, S, N, Se, Te, as only ring hetero atom]
- Y10T436/145555—Hetero-N
- Y10T436/147777—Plural nitrogen in the same ring [e.g., barbituates, creatinine, etc.]
Definitions
- Immunochromatographic strip formats have become increasingly popular for qualitative and semi-quantitative assays which use visual detection schemes.
- This type of immunoassay involves the application of a liquid test sample suspected of containing an analyte to be detected to an application zone of an immunochromatographic test strip.
- the strip is comprised of a matrix material through which the test fluid and analyte suspended or dissolved therein can flow by capillarity from the application zone to a capture zone where a detectable signal, or the absence of such, reveals the presence of the analyte.
- the strip will include means for immunospecifically binding the analyte to be detected with its specific binding partner which bears the detectable label. In one such scheme, as disclosed in U.S.
- the strip contains an enzyme labeled, mobile binding partner for the analyte which is in a zone downstream from the sample application zone. If analyte is present in the test sample, it will combine with its labeled binding partner to form a complex which will flow along the strip to a detection zone which contains a substrate for the enzyme label which is capable of providing a colored response in the presence of the enzyme label.
- the strip may contain a zone in which analyte is immobilized, so that labeled binding partner which does not combine with analyte, due to the absence of analyte in the sample, will be captured and thereby inhibited from reaching the detection zone.
- an alternative to the above described immunometric assay which detects the free labeled antibody is the so called sandwich format in which the capture zone contains immobilized antibodies against an epitope of the analyte which is different than the epitope to which the labeled antibody is specific.
- sandwich format in which the capture zone contains immobilized antibodies against an epitope of the analyte which is different than the epitope to which the labeled antibody is specific.
- sandwich format there is formed a sandwich of the analyte between the immobilized and labeled antibodies and it is therefore an immunometric assay which detects the bound labeled antibody species.
- U.S. Patent 4,806,311 there is disclosed a multizone test device for the specific binding assay determination of an analyte and an immobilized binding partner therefore together with a capture zone for receiving labeled reagent which migrates thereto from the reagent zone.
- the capture zone contains an immobilized form of a binding substance for the labeled reagent.
- the labeled reagent bears a chemical group having a detectable physical property which is detectable on the basis of its own physical properties, so that it does not require a chemical reaction with another substance. Exemplary of such groups are colored species of fluorescers, phosphorescent molecules, radioisotopes and electroactive moieties.
- a device for determining a target analyte and creatinine in a fluid test sample which device has an assay strip for the detection of creatinine and a second assay strip for the detection of the target analyte.
- the creatinine concentration may be determined colorimetrically or by the specific capture of labeled creatinine binding partners.
- the concentration of the target analyte is corrected based on the sample's creatinine concentration which correction can either be done manually or by means of a properly programmed reflectance analyzer.
- EP 0 462 376 A 2 discloses an immunochromatographic procedure in which signal at the capture site and the conjugate recovery site of the strip are detected and the analyte concentration is determined by the intensity of the signal at the capture site relative to the signal at the conjugate recovery site. Also of interest in this regard is U.S. Patent 5,569,608.
- Immunochromatographic strip formats provide a viable system for the determination of various analytes (whether they be antigens or antibodies) but suffer from the limitation that they yield results which are at best semi-quantitative when, for some analytes, more precise, quantitative results are required. Accordingly, it would be desirable and it is an object of the present invention to provide a means for quantifying the results of analyses carried out by the use of immunochromatographic strip formats.
- the present invention involves a method for determination of an analyte in a sample of body fluid which comprises the steps of:
- the present invention is practiced by first providing the test matrix through which the fluid test sample can flow by capillarity.
- the matrix will be in the form of a strip through which the test fluid flows horizontally. While the matrix could be assembled in a layered format through which the test fluid could flow vertically from top to bottom or vice-versa, the following discussion is focused on the preferred strip format.
- the strip can be prepared from any matrix material through which the test fluid and an analyte contained therein can flow by capillarity and can be of a material which is capable of supporting non-bibulous lateral flow.
- This type of flow is described in U.S. Patent 4,943,522 as liquid flow in which all of the dissolved or dispersed components of the liquid are carried through the matrix at substantially equal rates and with relatively unimpaired flow, as contrasted to preferential retention of one or more components as would be the case if the matrix material were capable of absorbing or imbibing one or more of the components.
- An example of such a matrix material is the high density or ultra high molecular weight polyethylene sheet material from Porex Technologies. Equally suitable for use as the matrix from which the chromatographic strips can be fabricated are bibulous materials such as paper, nitrocellulose and nylon.
- immunochromatographic strip formats are suitable for use in conjunction with the present invention.
- a particularly suitable format is that which is disclosed in U.S. Patent 4,446,232 in which there is described a device for the determination of the presence of antigens, which device comprises a strip of matrix material having a first zone in which there are provided immobilized analyte and enzyme linked antibodies specific to the analyte to be determined.
- the labeled antibodies can flow to a second zone when reacted with analyte introduced into the first zone via the test sample but will not so flow in the absence of analyte in the test fluid due to their being bound in the first region by interaction with the immobilized analyte.
- the analyte is typically antigen, although the format can be designed to detect the presence of antibodies as analyte. Modifications to this format are disclosed in U.S. Patent 4,868,108.
- the enzyme substrate is disposed in the region of a second, immobilized antibody to thereby capture the complex formed between the enzyme labeled binding partner and the analyte.
- This sort of format is particularly suitable for adaptation to the present invention, although any physically detectable signal generator may be used as the label since the present invention need not be limited to the interaction of an enzyme and its substrate to provide the detectable signal.
- the conjugate by immobilizing the conjugate in a discrete detection zone located downstream on the strip from the zone in which the labeled binding partner for the analyte is captured, there are provided two regions from which the physically detectable property of the label can be measured to determine its concentration.
- the signal from the detectable label in the second region of the matrix sometimes referred to as the capture zone
- the signal from the physically detectable property of the label in the third region sometimes referred to as the detection zone
- an immobilized antibody against the labeled binding partner e.g. anti-mouse IgG when the labeled binding partner is an antibody
- the accuracy is increased because this technique corrects for inaccuracies in labeled conjugate deposition and/or non-uniform flow through the matrix. More particularly, since the aforementioned inaccuracies of labeled conjugate deposition and non-uniform fluid flow are usually of small but significant magnitude, they do not substantially disturb the binding equilibrium. Therefore the ratio of the signals in the two binding regions is a more accurate measure of the analyte concentration than is the signal from either region by itself. This principle applies with equal force when the previously described sandwich format is used.
- the second and third zones of the matrix used in the present invention may each be divided into two or more bands with the second region preferably containing 1 to 3 discrete bands and the third region having 1 to 2 bands.
- the second and third regions of the matrix used in the present invention may each be divided into two or more bands with the second region preferably containing 1 to 3 discrete bands and the third region having 1 to 2 bands.
- Dynamic range refers to the fact that the overall signal can be increased if one focuses on more than a single capture or detection band within a zone.
- the detectable label is one which is detectable by a reflectance meter
- the difference between 70%R and 75%R represents a fairly small amount of detected label whereas the difference between 30%R and 35%R represents a high percentage of detected label.
- the error in reflectance reading stays constant or increases as the reflectance value decreases.
- it can be advantageous to use one or more additional capture or detection bands if this places the reflectance reading at a higher value where it is more sensitive to particle concentration.
- Example 1 In those assays in which a wide dynamic range is not necessary, simply reading and ratioing a single capture and a single detection region can give good quantitative results.
- Example 1 in which deoxypyridinoline is the first analyte, the capture zone is divided into 3 bands (P 1 , P 2 and P 3 ) while the detection zone is a single band (P 4 ) and the decode algorithm for the DPD assay is T/P n where T is the summation of the signal from all four bands. Algorithms using these reagent band reflectance values are constructed in such a way as to maximize the signal to noise ratio and thereby increase the quantitation of the assay by reducing coefficients of variation (CV).
- CV coefficients of variation
- the particular algorithm chosen will depend upon the number of reagent bands on the particular test strip being used and the sensitivity and/or precision of the assay.
- the relationship between the algorithm value and the analyte concentration is determined and fitted to a non-linear regression function. The purpose of such fitting is to minimize the error relating the chosen algorithm value to that of the analyte concentration.
- the regression function is used in order to determine a calibration curve which is used to relate the determined algorithm value to that of the analyte concentration. Once this relationship has been established, the calibration curve, which can be stored as an equation in the reflectance instrument, is used to calculate the analyte concentration.
- the capture and detection zones' reflectance changes opposite to one another i.e. the greater the signal from the capture zone the less the signal from the detection zone
- the use of multiple capture and/or detection bands is designed to alter this range of reflectance values.
- the mechanism by which analyte concentration changes the band's reflectance is a function of the chemistry of a particular assay. For sandwich assays, with increasing analyte concentration, the capture band reflectance increases and the detection band reflectance band reflectance decreases. For competitive assays, the capture band reflectance decreases and detection band reflectance increases with increasing amounts of analyte in the fluid test sample.
- additional capture and/or detection bands depends on whether changes in an additional band are significantly larger in a given analyte region than in any of the other bands.
- additional capture bands will also reduce the signal changes at the detection zone.
- a second capture band simply mirrors the first capture band but with reduced signal changes, and, in such cases, its need can be questioned.
- the addition of capture bands can reduce the signal in this zone.
- the crux of the present invention involves choosing a particular algorithm and additional capture and/or detection bands so as to alter the signal in such a way that it can be read with greater precision by a reflectance meter.
- the first is to increase the signal to noise ratio to as high a level as possible.
- Table 1 shows the Figure of Merit (FOM) differences between DPD levels of the various band reflectance changes and the use of various reflectance changes and the use of various algorithms.
- the FOM is calculated as (Avg1-Avg2)/(SD1+SD2) where Avg1 and Avg2 are the mean measured values for analyte level 1 and analyte level 2 and SD1 and SD2 are the standard deviations of the mean values for analyte level 1 and analyte level 2.
- Capture 1 is the IR corrected reflectance data for the Capture 1 band
- detection band 1 is the IR corrected reflectance data for detection band 2
- Cap1/Det1 is the K/S transformed data of Capture 1 divided by Detection 1
- the detection band performance decreases as the DPD concentration increases, whereas larger signal changes are noted for the capture band.
- the goal is to weight the reflectance values in such a way that the signal to noise ratio in the region most critical to the assay is maximized.
- This can be accomplished by use of FOM analysis and Algor 1 is designed to weight the differences of the two capture bands higher at low analyte concentrations where this difference is greatest with that weighting of the collection band over the total at higher analyte concentrations.
- the other goal of Algor 1 is to place this weighting in a way which allows fitting to a common four parameter fit used in many immunoassays.
- the second step in algorithm development is to use an equation which can be easily fitted and give accurate analyte concentrations for in between values. While FOM is a good method for distinguishing between two discrete analyte levels, it gives no information about the shape of the curve.
- the best approach is often one that uses an analysis which mimics the chemistry of the particular assay. For immunoassays this is often a four parameter fit equation.
- the test for any fitted equation and algorithm is the use of random samples with various analyte concentrations and the calculation of the error (% CV) and bias. The goal is to seek the lowest % CV with minimal bias throughout the expected range of the assay.
- a comparison of the DPD results 0-250 nM/mM in urine for two types of analyses is shown in Tables 2 and 3 for the three band immunostrips used in this illustration.
- the first algorithm has less error, as measured by the % CV, at all DPD values.
- This example illustrates the somewhat empirical method for finding a correct algorithm.
- the chosen algorithm will be one which has the lowest error associated with it for a given strip formulation and format and a given clinical range for the analyte.
- the instrument uses the reflectance value at one or more wavelengths of the reagent pad for the second analyte to determine the concentration of this analyte in the fluid test sample.
- the precision or the reduction of signal to noise
- the resulting error will produce a test which has little medical significance since as little as a two fold increase in the DPD/creatinine ratio occurs between the normal and osteoporosis states.
- the second analyte is selected from those materials in the body fluid which are clinically related to the first analyte.
- the most notable example of a second analyte is creatinine, the end metabolite when creatine becomes creatine phosphate which is used as an energy source for muscle contraction.
- the creatinine produced is filtered by the kidney glomeruli and then excreted into the urine without reabsorption.
- analyte/creatinine ratios are used in urine protein assays to normalize the urine concentration.
- creatinine assays include the alkaline Jaffe and Benedict-Behre methods which are run at a high pH, typically in the range of from 11.5 to 12.5. More recently, there has been developed a creatinine assay in which the urine sample is contacted with cupric ions in the presence of citrate, a hydroperoxide and an oxidizable dye which provides a colored response in the presence of oxygen free radicals and a pseudoperoxide. This method is more fully described in U.S. Patent 5,374,561. Creatinine quantitation may also be accomplished immunologically as described in WO-96/34271.
- the body fluid tested can be whole blood
- the first (target) analyte can be HbA 1c
- the second analyte can be total hemoglobin since the apparent concentration of HbA 1c can be adjusted to the whole blood's total hemoglobin concentration to factor out bias in the HbA 1c assay.
- Inulin, administered intravenously, is, like creatinine, an indicator of renal flow.
- the first analyte can be total prostate specific antigen and the second analyte free prostate specific antigen.
- Another pair of analytes whose concentrations are clinically related are alanine aminotransferase (ALT) and aspartate aminotransferase (AST) which are widely distributed in human tissues. Both AST and ALT are normally present in human plasma, bile and saliva. With viral hepatitis and other forms of liver disease, levels of AST and ALT are elevated even before clinical signs of disease, such as jaundice, appear. In toxic or viral hepatitis, ALT is characteristically as high or higher than the ALT and the ALT/AST ratio, which is normally ⁇ 1, approaches or becomes greater than unity. Furthermore, AST concentrations increase after myocardial infarction thereby changing the ratio of these two enzymes and their activity. Thus, clinically significant results can be obtained by determining the ratio of these two analytes in serum.
- DPD deoxypyridinoline
- human serum albumin drugs of abuse such as amphetamines/barbiturates/cocaine
- clinically important protein markers such as prostate specific antigen
- kidney disease proteins such as lactate dehydrogenase, N-acetyl-B-D-glucosamindase
- pregnancy or fertility associated hormones such as human chorionic gonadotropin, follicle-stimulating hormone and lutenizing hormone
- markers of urinary tract infection such as Tamm-Horsfall protein or lipopolysaccharide, beta-2-microglobulin, amylase and chlamydial LPS. Determining the ratio of IgA/IgG to assess infection can be accomplished by means of the present invention. Correcting their absolute concentrations for variations in renal flow by ratioing these concentrations to observed creatinine concentrations increases the precision and accuracy of the measurements.
- a reflectance meter with means for moving the strip or the meter's detector element relative to each other such as by use of a specimen table for the strip which can be moved laterally under the readhead of the detector. This technique will assist in providing accurate quantitation for regions of the strip which may not have been precisely located with respect to the detection means of the reflectance meter. More specifically, the location of the strip relative to the detector can be under microprocessor control, so that the reflectance from the second, third or fourth regions of the strip, and individual bands within these regions, can be individually determined.
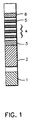
- a test strip for the determination of creatinine and deoxypyridinoline (DPD) containing six distinct areas assembled together onto a polystyrene backing of 4 inches (101.6 mm) in length and 0.2 inch (5.0 mm) in width is illustrated by Fig. 1.
- area 1 is the creatinine pad with a size of 0.2 x 0.2 inch.
- the creatinine pad was prepared as follows to render it suitable for the colorimetric determination of creatinine: Whatman 3 mm filter paper was first treated by dipping it to a depth of 0.2 inch into a solution containing 30 mM copper sulfate, 50 mM citrate, 750 mM glycerol-2-phosphate, 0.2% hexane sulfonic acid, 50 mM phytic acid and 0.2% sodium dodecyl sulfonate (SDS) at pH 6.94.
- the strip was dipped into a solution containing 33 mM 3,3',5,5'-tetramethylbenzidine, 73 mM diisopropylbenzene dihydroperoxide, 63 mM triisopropanolamine borate, 0.5% plasonde and 0.032% ethyl orange.
- the intensity of the colored response produced when the strip is contacted with an aqueous medium containing creatinine is proportionate to the concentration of creatinine.
- Area 2 is the buffer pad, prepared by impregnation of Whatman F075-07 glass fiber with 0.5 to 1 M glycine and 175 to 350 mM urea and having a size of 0.2 x 0.5 inch (12.7 mm).
- the buffer pad serves the purpose of buffering the pH of urine samples to the desired value.
- the pH of urine can range from 4.5 to 8 and a buffer pad can be used to keep the samples at a pH >7 to favor the antigen/antibody bonding reaction.
- Area 3 is a gold sol-DPD antibody pad (first region containing a labeled binding partner specific for the analyte).
- Areas 4 and 5 are the immunochromatography development area where the capture and detection reagents are deposited onto one piece of nitrocellulose having a size of 0.2 x 1.25 inch (31.75 mm).
- Area 4 contains three capture bands (second region containing immobilized analyte) with DPD immobilized to carboxyl terminated polyethylene glycol with a band width of about 0.059 inch (1.5 mm) per band and a 0.2 inch space between the bands (from center to center).
- area 5 consisting of one anti-IgG collection band (third region for immobilizing unreacted labeled binding partner) with a band width of about 0.059 inch (1.5 mm).
- the absorbant pad 6 which serves to absorb the liquid which migrates from the nitrocellulose area of the strip having a size of 0.2 inch x 0.5 inch (12.7 mm).
- the strip was dipped into the test solution, i.e. a urine sample containing the DPD analyte to be determined, for 3 seconds to a depth such that only the creatinine zone and buffer pad were below the surface of the test solution which allowed the test solution to flow up the strip by capillarity through the capture bands of the capture region, the single band of the detection region and to the absorbant pad.
- the strip was placed on the read table of a CLINITEK® 50 reflectance spectrometer and the device's start button pressed. The creatinine pad reflectance was recorded at 3 minutes and the reflectance of the immuno DPD strip (all 4 bands) was measured and recorded at 3 minutes.
- Reflectance signals for the DPD assay were measured with IR and green filters whereas reflectance for the creatinine assay was measured using red and green filters.
- the device gives a response in decode values which is derived by equations 1 to 5. where [R] green is the reflectance measured with the green filter, [R] red is the reflectance measured with the red filter.
- the band response signals were designated as indicated in Table 4.
- the reflectance with the green filter is ratioed to the reflectance with the IR filter to reduce the error from the variations between strips such as height and surface variations.
- the reflectance at the IR wave-length remains fairly constant regardless of the gold sol intensity of the band.
- the corrected reflectance, [Rn], is calculated according to Equation 2. where n is the band number 1, 2, 3 or 4, [Rn] green is the reflectance of band n with green filter, [Rn] IR is the reflectance of band n with IR filter.
- the number 65 is the assigned corrected reference value since the % reflectance with the IR filter is about 65%.
- the IR corrected reflectance value, [Rn] is then converted to K/S according to Equation 3 to give the band response signal for each band: where band signal, Pn, is the K/S transformation reflectance value, [Rn].
- T is the summation of the band signal for all bands (Equation 5).
- N is the total number of capture bands and collection bands which is 4 in the present example, Pn is the band signal n and n is 1, 2, 3 or 4.
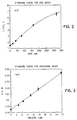
- Standard curves for DPD and creatinine were generated using calibrators containing six levels of analyte concentrations. Examples of standard curves are shown in Fig. 2 for the DPD assay and Fig. 3 for the creatinine assay.
- the DPD and creatinine concentrations for the urine test sample were calculated from the DPD and creatinine standard curves respectively.
- the DPD/creatinine ratio in nM/mM was then calculated for urine sample A as per the following calculation:
- the cutoff for determination of a state of high bone resorption is a DPD/creatinine ratio is 7.4 nM/mM. Lower than 7.4 is normal and larger than 7.4 is at the state of high bone resorption. Therefore, in this example, the result indicates a state of high bone resorption.
- a second urine sample was analyzed in a similar manner and gave the following results:
- the band signals require reflectance measurement at different wavelengths (IR, green and red) using an instrument with the capability to measure and record the reflectance at these wavelengths.
- the reflectance measurements are ratioed based on a predetermined a]gorithm using the instrument's software.
- the analyte concentrations are determined using standard curves stored in the instrument and the DPD/creatinine ratio is computed using the software set up in the instrument.
- the use of this algorithm enhances the accuracy of the assay because ratioing the band signal minimizes the systematic error such as error introduced by instrument to instrument variation.
- Other algorithms may be used to determine the final response signal.
- the final response signal can be calculated as: [Capture Band 1/Detection Band 1] where all signals are K/S transformation reflectance values.
- W cap and W det are weighting functions which weight the capture bands and detection bands differently.
- the calculation of the response signal by ratioing the signals from the labeled binding partner immobilized in the second (capture) region of the strip and the labeled binding partner immobilized in the third (detection) region is critical to increasing the precision of the assay by reducing the signal to noise ratio. This enhanced precision is necessary for the test to have clinical significance since only a two-fold increase in the DPD/creatinine ratio occurs between the normal and disease indicating osteoporosis states.
- Tables 8-10 Further evidence of the improvement in analytical results that can be achieved by the present invention is presented in Tables 8-10. These table were prepared using the same data set but 3 different algorithms ([T/P 1 ] with band ratioing, % reflectance of first capture band with no IR correction and no band ratioing and % reflectance of first capture band with no band ratioing but with IR correction) are compared.
Abstract
Description
- Immunochromatographic strip formats have become increasingly popular for qualitative and semi-quantitative assays which use visual detection schemes. This type of immunoassay involves the application of a liquid test sample suspected of containing an analyte to be detected to an application zone of an immunochromatographic test strip. The strip is comprised of a matrix material through which the test fluid and analyte suspended or dissolved therein can flow by capillarity from the application zone to a capture zone where a detectable signal, or the absence of such, reveals the presence of the analyte. Typically, the strip will include means for immunospecifically binding the analyte to be detected with its specific binding partner which bears the detectable label. In one such scheme, as disclosed in U.S. Patent 4,446,232; the strip contains an enzyme labeled, mobile binding partner for the analyte which is in a zone downstream from the sample application zone. If analyte is present in the test sample, it will combine with its labeled binding partner to form a complex which will flow along the strip to a detection zone which contains a substrate for the enzyme label which is capable of providing a colored response in the presence of the enzyme label. The strip may contain a zone in which analyte is immobilized, so that labeled binding partner which does not combine with analyte, due to the absence of analyte in the sample, will be captured and thereby inhibited from reaching the detection zone. There have been published various modifications of this technique, all of which involve some competitive specific binding system in which the presence or absence of analyte in the test sample is determined by the detection or lack thereof of labeled binding partner in the capture zone.
- An alternative to the above described immunometric assay which detects the free labeled antibody is the so called sandwich format in which the capture zone contains immobilized antibodies against an epitope of the analyte which is different than the epitope to which the labeled antibody is specific. In this format, there is formed a sandwich of the analyte between the immobilized and labeled antibodies and it is therefore an immunometric assay which detects the bound labeled antibody species.
- Not all of the schemes for immunochromatography rely on an enzyme labeled binding partner/enzyme substrate for providing the signal for detection of the analyte. In U.S. Patent 4,806,311 there is disclosed a multizone test device for the specific binding assay determination of an analyte and an immobilized binding partner therefore together with a capture zone for receiving labeled reagent which migrates thereto from the reagent zone. The capture zone contains an immobilized form of a binding substance for the labeled reagent. The labeled reagent bears a chemical group having a detectable physical property which is detectable on the basis of its own physical properties, so that it does not require a chemical reaction with another substance. Exemplary of such groups are colored species of fluorescers, phosphorescent molecules, radioisotopes and electroactive moieties.
- United States Patent 4,703,017 describes the use of visible particulate labels for the receptor. Various particulate labels such as gold so] particles and visible dye containing liposomes are mentioned.
- In WO-96/34271 there is disclosed a device for determining a target analyte and creatinine in a fluid test sample which device has an assay strip for the detection of creatinine and a second assay strip for the detection of the target analyte. The creatinine concentration may be determined colorimetrically or by the specific capture of labeled creatinine binding partners. The concentration of the target analyte is corrected based on the sample's creatinine concentration which correction can either be done manually or by means of a properly programmed reflectance analyzer.
-
EP 0 462 376 A2 discloses an immunochromatographic procedure in which signal at the capture site and the conjugate recovery site of the strip are detected and the analyte concentration is determined by the intensity of the signal at the capture site relative to the signal at the conjugate recovery site. Also of interest in this regard is U.S. Patent 5,569,608. - Immunochromatographic strip formats provide a viable system for the determination of various analytes (whether they be antigens or antibodies) but suffer from the limitation that they yield results which are at best semi-quantitative when, for some analytes, more precise, quantitative results are required. Accordingly, it would be desirable and it is an object of the present invention to provide a means for quantifying the results of analyses carried out by the use of immunochromatographic strip formats.
- The present invention involves a method for determination of an analyte in a sample of body fluid which comprises the steps of:
- a) providing a test strip comprising a matrix through which the fluid sample can flow by capillarity, said strip having a first region which contains mobile specific binding partner for the analyte which binding partner bears a detectable label and can react with the analyte to form an analyte/labeled binding partner complex, at least one second region which contains immobilized analyte or an immobilized binding partner which is specific for an epitope of the analyte different than that to which the labeled binding partner is specific, at least one third region which contains means for capturing the analyte/labeled specific binding partner complex which is not bound in the second region and a fourth region which contains means for producing a detectable signal the intensity of which corresponds to the level of a second analyte whose concentration is clinically related to that of the analyte whose concentration in the body fluid is being determined;
- b) developing the matrix by applying a sample of a body fluid suspected of containing the first and second analytes thereto thereby allowing it to contact the labeled specific binding partner so that the analyte present in the fluid sample binds to the labeled specific binding partner to form a complex while leaving excess, unreacted labeled binding partner free to further react whereby the fluid sample carries the analyte/labeled partner complex and unreacted labeled binding partner along the matrix by capillarity to the second region containing the immobilized analyte in which region unreacted labeled binding partner is bound to the immobilized analyte in inverse relationship to the concentration of the first analyte in the fluid test sample or is bound to the immobilized specific binding partner in a direct relationship to the concentration of analyte in the fluid test sample; and the labeled specific binding partner which did not bind to the second region is carried by capillarity to the third region where it is captured by the capture means;
- c) reading the second zone of the developed matrix on an instrument having a detector capable of measuring the signal from the detectable label to determine the concentration of the labeled binding partner in the second zone and reading the third zone of the developed strip in a similar manner to determine the signal from the labeled binding partner in the third zone of the matrix;
- d) determining a final response signal by ratioing the signals from the labeled binding partner immobilized in the second region and the labeled binding partner captured in the third region;
- e) determining the concentration of the first
analyte in the fluid sample by comparing the
final response signal determined in step (d)
with final response signals determined in a
similar manner for fluid samples containing
known concentrations of the first analyte;
and - f) correcting the concentration of the first analyte determined in step (e) by determining the concentration of the second analyte in the fluid test sample by measuring the intensity of the signal in the fourth region of the matrix and converting this to a concentration value of the second analyte and then determining the ratio of the second analyte to the first analyte whose quantitative concentration is being sought.
-
- The present invention is practiced by first providing the test matrix through which the fluid test sample can flow by capillarity. Typically, the matrix will be in the form of a strip through which the test fluid flows horizontally. While the matrix could be assembled in a layered format through which the test fluid could flow vertically from top to bottom or vice-versa, the following discussion is focused on the preferred strip format.
- The strip can be prepared from any matrix material through which the test fluid and an analyte contained therein can flow by capillarity and can be of a material which is capable of supporting non-bibulous lateral flow. This type of flow is described in U.S. Patent 4,943,522 as liquid flow in which all of the dissolved or dispersed components of the liquid are carried through the matrix at substantially equal rates and with relatively unimpaired flow, as contrasted to preferential retention of one or more components as would be the case if the matrix material were capable of absorbing or imbibing one or more of the components. An example of such a matrix material is the high density or ultra high molecular weight polyethylene sheet material from Porex Technologies. Equally suitable for use as the matrix from which the chromatographic strips can be fabricated are bibulous materials such as paper, nitrocellulose and nylon.
- Various immunochromatographic strip formats are suitable for use in conjunction with the present invention. A particularly suitable format is that which is disclosed in U.S. Patent 4,446,232 in which there is described a device for the determination of the presence of antigens, which device comprises a strip of matrix material having a first zone in which there are provided immobilized analyte and enzyme linked antibodies specific to the analyte to be determined. The labeled antibodies can flow to a second zone when reacted with analyte introduced into the first zone via the test sample but will not so flow in the absence of analyte in the test fluid due to their being bound in the first region by interaction with the immobilized analyte. The analyte is typically antigen, although the format can be designed to detect the presence of antibodies as analyte. Modifications to this format are disclosed in U.S. Patent 4,868,108. In another modification, the enzyme substrate is disposed in the region of a second, immobilized antibody to thereby capture the complex formed between the enzyme labeled binding partner and the analyte. This sort of format is particularly suitable for adaptation to the present invention, although any physically detectable signal generator may be used as the label since the present invention need not be limited to the interaction of an enzyme and its substrate to provide the detectable signal. Thus, by immobilizing the conjugate in a discrete detection zone located downstream on the strip from the zone in which the labeled binding partner for the analyte is captured, there are provided two regions from which the physically detectable property of the label can be measured to determine its concentration. By measuring the signal from the detectable label in the second region of the matrix (sometimes referred to as the capture zone) and the signal from the physically detectable property of the label in the third region (sometimes referred to as the detection zone), in which an immobilized antibody against the labeled binding partner (e.g. anti-mouse IgG when the labeled binding partner is an antibody) is the capture means, and determining the ratio of these signals, the accuracy of the test for analyte concentration can be increased. The accuracy is increased because this technique corrects for inaccuracies in labeled conjugate deposition and/or non-uniform flow through the matrix. More particularly, since the aforementioned inaccuracies of labeled conjugate deposition and non-uniform fluid flow are usually of small but significant magnitude, they do not substantially disturb the binding equilibrium. Therefore the ratio of the signals in the two binding regions is a more accurate measure of the analyte concentration than is the signal from either region by itself. This principle applies with equal force when the previously described sandwich format is used.
- The second and third zones of the matrix used in the present invention may each be divided into two or more bands with the second region preferably containing 1 to 3 discrete bands and the third region having 1 to 2 bands. By dividing these regions into bands it is possible to increase the dynamic range and/or precision of the assay due to the non-linearity of reflectance to the number of detected labeled binding partners. Dividing the regions into discrete bands can be desirable because the measurement of small changes in detected labeled binding partner is more robust at higher values of reflectance than at low values. The number of capture and/or collection bands which are desirable will depend on the particular assay for which the strip is designed since dividing the capture and collection zones into 2 or more discrete bands will increase the dynamic range of certain assays but not of others. Dynamic range refers to the fact that the overall signal can be increased if one focuses on more than a single capture or detection band within a zone. Thus, when the detectable label is one which is detectable by a reflectance meter, there can be a large nonlinearity of reflectance and the error associated with the reflectance meter used. For example, the difference between 70%R and 75%R represents a fairly small amount of detected label whereas the difference between 30%R and 35%R represents a high percentage of detected label. With the use of certain reflectance meters, the error in reflectance reading stays constant or increases as the reflectance value decreases. Thus, it can be advantageous to use one or more additional capture or detection bands if this places the reflectance reading at a higher value where it is more sensitive to particle concentration. In those assays in which a wide dynamic range is not necessary, simply reading and ratioing a single capture and a single detection region can give good quantitative results. This is illustrated by the following Example 1 in which deoxypyridinoline is the first analyte, the capture zone is divided into 3 bands (P1, P2 and P3) while the detection zone is a single band (P4) and the decode algorithm for the DPD assay is T/Pn where T is the summation of the signal from all four bands. Algorithms using these reagent band reflectance values are constructed in such a way as to maximize the signal to noise ratio and thereby increase the quantitation of the assay by reducing coefficients of variation (CV). The particular algorithm chosen will depend upon the number of reagent bands on the particular test strip being used and the sensitivity and/or precision of the assay. Once the appropriate algorithm is chosen, the relationship between the algorithm value and the analyte concentration is determined and fitted to a non-linear regression function. The purpose of such fitting is to minimize the error relating the chosen algorithm value to that of the analyte concentration. The regression function is used in order to determine a calibration curve which is used to relate the determined algorithm value to that of the analyte concentration. Once this relationship has been established, the calibration curve, which can be stored as an equation in the reflectance instrument, is used to calculate the analyte concentration.
- Since the capture and detection zones' reflectance changes opposite to one another, i.e. the greater the signal from the capture zone the less the signal from the detection zone, the use of multiple capture and/or detection bands is designed to alter this range of reflectance values. The mechanism by which analyte concentration changes the band's reflectance is a function of the chemistry of a particular assay. For sandwich assays, with increasing analyte concentration, the capture band reflectance increases and the detection band reflectance band reflectance decreases. For competitive assays, the capture band reflectance decreases and detection band reflectance increases with increasing amounts of analyte in the fluid test sample.
- The need for additional capture and/or detection bands depends on whether changes in an additional band are significantly larger in a given analyte region than in any of the other bands. Depending upon the label (i.e. gold sol) concentration, additional capture bands will also reduce the signal changes at the detection zone. In certain assays, a second capture band simply mirrors the first capture band but with reduced signal changes, and, in such cases, its need can be questioned. However, in those assays in which the detection zone is too dark due to low reflectance, the addition of capture bands can reduce the signal in this zone.
- In general, the crux of the present invention involves choosing a particular algorithm and additional capture and/or detection bands so as to alter the signal in such a way that it can be read with greater precision by a reflectance meter.
- There are two steps involved in developing an appropriate algorithm. The first is to increase the signal to noise ratio to as high a level as possible. The second is to define an algorithm which easily fits an equation so that accurate values for any analyte concentration may be obtained. This is demonstrated by the following study involving a strip containing three bands (2 capture bands and one detection band). The two capture bands had different capture reagent concentrations with the first capture band having a 10-fold lower capture reagent concentration than the second. This format demonstrates that different combinations and concentrations of capture and collection bands can be used depending upon the unique properties of each assay. Data were taken (representing N=18 for each analyte level) using 3
different CLINITEK® 50 reflectance meters over a period of 2 days. Table 1 shows the Figure of Merit (FOM) differences between DPD levels of the various band reflectance changes and the use of various reflectance changes and the use of various algorithms. The FOM is calculated as (Avg1-Avg2)/(SD1+SD2) where Avg1 and Avg2 are the mean measured values foranalyte level 1 andanalyte level 2 and SD1 and SD2 are the standard deviations of the mean values foranalyte level 1 andanalyte level 2.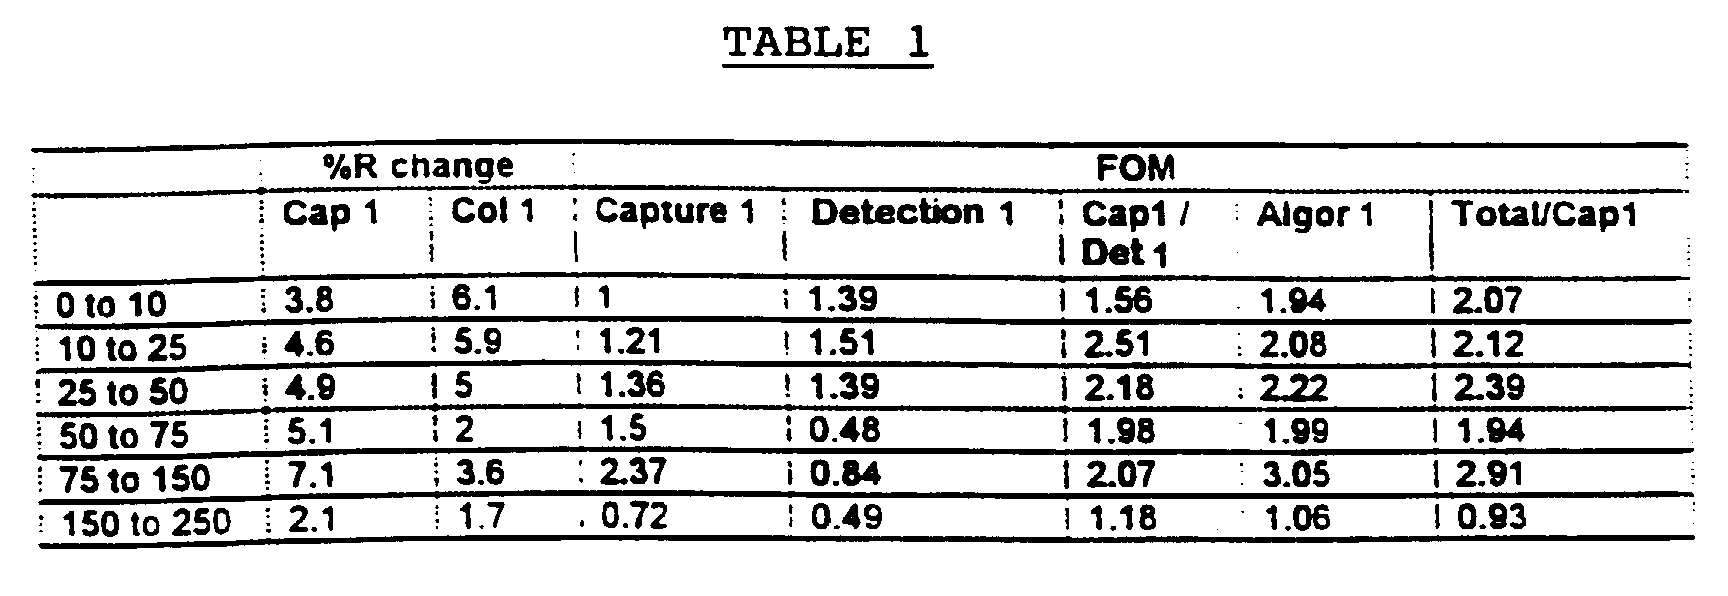
- In Table 1,
Capture 1 is the IR corrected reflectance data for theCapture 1 band,detection band 1 is the IR corrected reflectance data fordetection band 2, Cap1/Det1 is the K/S transformed data ofCapture 1 divided byDetection 1 andAlgor 1 is:Capture Band 2/Σ Capture Bands)*ABS(2-C)}Capture 1Algor 1 is designed to weight the differences of the two capture bands higher at low analyte concentrations where this difference is greatest with that weighting of the collection band over the total at higher analyte concentrations. The other goal ofAlgor 1 is to place this weighting in a way which allows fitting to a common four parameter fit used in many immunoassays. - The second step in algorithm development is to use an equation which can be easily fitted and give accurate analyte concentrations for in between values. While FOM is a good method for distinguishing between two discrete analyte levels, it gives no information about the shape of the curve. The best approach is often one that uses an analysis which mimics the chemistry of the particular assay. For immunoassays this is often a four parameter fit equation. The test for any fitted equation and algorithm is the use of random samples with various analyte concentrations and the calculation of the error (% CV) and bias. The goal is to seek the lowest % CV with minimal bias throughout the expected range of the assay. A comparison of the DPD results 0-250 nM/mM in urine for two types of analyses is shown in Tables 2 and 3 for the three band immunostrips used in this illustration.


- From the data of Tables 2 and 3, it can be determined that for this particular analysis, the first algorithm has less error, as measured by the % CV, at all DPD values. This example illustrates the somewhat empirical method for finding a correct algorithm. The chosen algorithm will be one which has the lowest error associated with it for a given strip formulation and format and a given clinical range for the analyte.
- After the value for the target analyte has been obtained, the instrument uses the reflectance value at one or more wavelengths of the reagent pad for the second analyte to determine the concentration of this analyte in the fluid test sample. In the case in which DPD is the target analyte and creatinine is the second analyte, the precision (or the reduction of signal to noise) is critical to the assay for both analytes. Absent a high level of precision, the resulting error will produce a test which has little medical significance since as little as a two fold increase in the DPD/creatinine ratio occurs between the normal and osteoporosis states. The second analyte is selected from those materials in the body fluid which are clinically related to the first analyte. The most notable example of a second analyte is creatinine, the end metabolite when creatine becomes creatine phosphate which is used as an energy source for muscle contraction. The creatinine produced is filtered by the kidney glomeruli and then excreted into the urine without reabsorption. In order to increase the sensitivity of urinary assays and minimize the problem of high urine flow rates which result in urine dilution, analyte/creatinine ratios are used in urine protein assays to normalize the urine concentration. Common creatinine assays include the alkaline Jaffe and Benedict-Behre methods which are run at a high pH, typically in the range of from 11.5 to 12.5. More recently, there has been developed a creatinine assay in which the urine sample is contacted with cupric ions in the presence of citrate, a hydroperoxide and an oxidizable dye which provides a colored response in the presence of oxygen free radicals and a pseudoperoxide. This method is more fully described in U.S. Patent 5,374,561. Creatinine quantitation may also be accomplished immunologically as described in WO-96/34271. Those second analytes whose concentration in the body fluid sample is clinically related to the concentration of the target analyte are not limited to creatinine in urine nor is urine the only body fluid which can be assayed by the method of the present invention. Thus, for example, the body fluid tested can be whole blood, the first (target) analyte can be HbA1c and the second analyte can be total hemoglobin since the apparent concentration of HbA1c can be adjusted to the whole blood's total hemoglobin concentration to factor out bias in the HbA1c assay. Inulin, administered intravenously, is, like creatinine, an indicator of renal flow. In serology based assays the first analyte can be total prostate specific antigen and the second analyte free prostate specific antigen. Another pair of analytes whose concentrations are clinically related are alanine aminotransferase (ALT) and aspartate aminotransferase (AST) which are widely distributed in human tissues. Both AST and ALT are normally present in human plasma, bile and saliva. With viral hepatitis and other forms of liver disease, levels of AST and ALT are elevated even before clinical signs of disease, such as jaundice, appear. In toxic or viral hepatitis, ALT is characteristically as high or higher than the ALT and the ALT/AST ratio, which is normally <1, approaches or becomes greater than unity. Furthermore, AST concentrations increase after myocardial infarction thereby changing the ratio of these two enzymes and their activity. Thus, clinically significant results can be obtained by determining the ratio of these two analytes in serum.
- Many clinically significant target analytes are present in urine and are determinable by means of the present invention. Among these analytes are deoxypyridinoline (DPD), human serum albumin, drugs of abuse such as amphetamines/barbiturates/cocaine, clinically important protein markers such as prostate specific antigen, kidney disease proteins such as lactate dehydrogenase, N-acetyl-B-D-glucosamindase, pregnancy or fertility associated hormones such as human chorionic gonadotropin, follicle-stimulating hormone and lutenizing hormone, markers of urinary tract infection such as Tamm-Horsfall protein or lipopolysaccharide, beta-2-microglobulin, amylase and chlamydial LPS. Determining the ratio of IgA/IgG to assess infection can be accomplished by means of the present invention. Correcting their absolute concentrations for variations in renal flow by ratioing these concentrations to observed creatinine concentrations increases the precision and accuracy of the measurements.
- While the means for detecting the signal from the developed strip will depend on the detectable label attached to the labeled binding partner, the use of a reflectance meter is typical when the label's detectable physical property is the reflectance of light at a predetermined wavelength in the visible or infrared region of the spectrum. In a preferred embodiment, there is provided a reflectance meter with means for moving the strip or the meter's detector element relative to each other such as by use of a specimen table for the strip which can be moved laterally under the readhead of the detector. This technique will assist in providing accurate quantitation for regions of the strip which may not have been precisely located with respect to the detection means of the reflectance meter. More specifically, the location of the strip relative to the detector can be under microprocessor control, so that the reflectance from the second, third or fourth regions of the strip, and individual bands within these regions, can be individually determined.
- The method of practicing the present invention is more fully illustrated by the following examples:
- A test strip for the determination of creatinine and deoxypyridinoline (DPD) containing six distinct areas assembled together onto a polystyrene backing of 4 inches (101.6 mm) in length and 0.2 inch (5.0 mm) in width is illustrated by Fig. 1. Referring to Fig. 1,
area 1 is the creatinine pad with a size of 0.2 x 0.2 inch. The creatinine pad was prepared as follows to render it suitable for the colorimetric determination of creatinine:Whatman 3 mm filter paper was first treated by dipping it to a depth of 0.2 inch into a solution containing 30 mM copper sulfate, 50 mM citrate, 750 mM glycerol-2-phosphate, 0.2% hexane sulfonic acid, 50 mM phytic acid and 0.2% sodium dodecyl sulfonate (SDS) at pH 6.94. After drying, the strip was dipped into a solution containing 33mM Area 2 is the buffer pad, prepared by impregnation of Whatman F075-07 glass fiber with 0.5 to 1 M glycine and 175 to 350 mM urea and having a size of 0.2 x 0.5 inch (12.7 mm). The buffer pad serves the purpose of buffering the pH of urine samples to the desired value. For example, the pH of urine can range from 4.5 to 8 and a buffer pad can be used to keep the samples at a pH >7 to favor the antigen/antibody bonding reaction. There is a 0.1 inch (2.5 mm) gap betweencreatinine pad 1 andbuffer pad 2 for purposes of isolating the creatinine reagent from the buffer pad reagent.Area 3 is a gold sol-DPD antibody pad (first region containing a labeled binding partner specific for the analyte).Areas Area 4 contains three capture bands (second region containing immobilized analyte) with DPD immobilized to carboxyl terminated polyethylene glycol with a band width of about 0.059 inch (1.5 mm) per band and a 0.2 inch space between the bands (from center to center). At 0.2 inch from the center of the third capture band isarea 5 consisting of one anti-IgG collection band (third region for immobilizing unreacted labeled binding partner) with a band width of about 0.059 inch (1.5 mm). At 0.2 inch above the collection band is theabsorbant pad 6 which serves to absorb the liquid which migrates from the nitrocellulose area of the strip having a size of 0.2 inch x 0.5 inch (12.7 mm). - To perform the assay, the strip was dipped into the test solution, i.e. a urine sample containing the DPD analyte to be determined, for 3 seconds to a depth such that only the creatinine zone and buffer pad were below the surface of the test solution which allowed the test solution to flow up the strip by capillarity through the capture bands of the capture region, the single band of the detection region and to the absorbant pad. At the end of the 3 second dip the strip was placed on the read table of a
CLINITEK® 50 reflectance spectrometer and the device's start button pressed. The creatinine pad reflectance was recorded at 3 minutes and the reflectance of the immuno DPD strip (all 4 bands) was measured and recorded at 3 minutes. Reflectance signals for the DPD assay were measured with IR and green filters whereas reflectance for the creatinine assay was measured using red and green filters. The device gives a response in decode values which is derived byequations 1 to 5.where [R]green is the reflectance measured with the green filter, [R]red is the reflectance measured with the red filter.
- For the DPD assay, the band response signals were designated as indicated in Table 4.The reflectance with the green filter is ratioed to the reflectance with the IR filter to reduce the error from the variations between strips such as height and surface variations. The reflectance at the IR wave-length remains fairly constant regardless of the gold sol intensity of the band. The corrected reflectance, [Rn], is calculated according to

Equation 2.where n is the
band number - The IR corrected reflectance value, [Rn], is then converted to K/S according to
Equation 3 to give the band response signal for each band:where band signal, Pn, is the K/S transformation reflectance value, [Rn].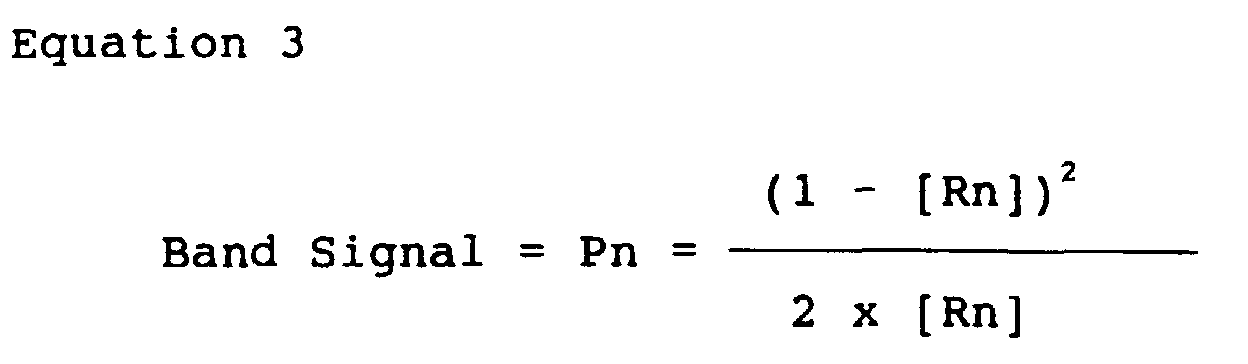
- The response decode of each band is finally computed according to
Equation 4.where T is the summation of the band signal for all bands (Equation 5). where N is the total number of capture bands and collection bands which is 4 in the present example, Pn is the band signal n and n is 1, 2, 3 or 4.
- Standard curves for DPD and creatinine were generated using calibrators containing six levels of analyte concentrations. Examples of standard curves are shown in Fig. 2 for the DPD assay and Fig. 3 for the creatinine assay. The DPD and creatinine concentrations for the urine test sample were calculated from the DPD and creatinine standard curves respectively. The DPD/creatinine ratio in nM/mM was then calculated for urine sample A as per the following calculation:
- DPD concentration calculated from the DPD standard curve = 123 nM
- Creatinine concentration calculated from the creatinine standard curve = 10.2 mM
- The DPD/creatinine ratio = 123 nM/10.2 mM = 12.1 nM/mm.
-
- The cutoff for determination of a state of high bone resorption is a DPD/creatinine ratio is 7.4 nM/mM. Lower than 7.4 is normal and larger than 7.4 is at the state of high bone resorption. Therefore, in this example, the result indicates a state of high bone resorption. A second urine sample was analyzed in a similar manner and gave the following results:
- DPD concentration = 123 nM
- Creatinine concentration = 20.5 mM
- DPD/Creatinine ratio = 6.0 nM/mM. Although the DPD concentration is the same, the ratio of DPD to creatinine indicates a state of low bone resorption.
-
- Five runs were made using the above procedure with urine samples containing varying amounts of DPD and creatinine. The expected and observed ratios as well as standard deviations, % coefficient of variance and positive/negative biases are set out in Table 5. From Table 5 it can be determined that a precision of less than 12% CV was obtained at three levels, 4.52, 7.54 and 12.07 nM/mM of DPD to creatinine.

- While the gold sol labeled antibodies are visually observable in the capture and collection zones of the strip, clinically meaningful results are obtainable only through the use of a reflectance meter. This is the case because of the use of multiple bands across the entire length of the strip. In addition, the band signals require reflectance measurement at different wavelengths (IR, green and red) using an instrument with the capability to measure and record the reflectance at these wavelengths. The reflectance measurements are ratioed based on a predetermined a]gorithm using the instrument's software. Furthermore, the analyte concentrations are determined using standard curves stored in the instrument and the DPD/creatinine ratio is computed using the software set up in the instrument.
- In the above example, the final response signal (decode) for the DPD assay was determined using the algorithm decode = [T/Pn] where T is the summation of the signal from all four bands and Pn is the band signal of
band 1. The use of this algorithm enhances the accuracy of the assay because ratioing the band signal minimizes the systematic error such as error introduced by instrument to instrument variation. Other algorithms may be used to determine the final response signal. The response signal in this example was determined as: - The advantages of using band ratioing is demonstrated by the data of Tables 6 and 7 from which it can be determined that the precision with which the strip can determine the concentration of DPD is much greater than that which is obtainable when using only the signal from the capture zone.

- Alternatively, the final response signal can be calculated as:
Capture Band 1/Detection Band 1]Capture Band 1/W - The calculation of the response signal by ratioing the signals from the labeled binding partner immobilized in the second (capture) region of the strip and the labeled binding partner immobilized in the third (detection) region is critical to increasing the precision of the assay by reducing the signal to noise ratio. This enhanced precision is necessary for the test to have clinical significance since only a two-fold increase in the DPD/creatinine ratio occurs between the normal and disease indicating osteoporosis states.
- Further evidence of the improvement in analytical results that can be achieved by the present invention is presented in Tables 8-10. These table were prepared using the same data set but 3 different algorithms ([T/P1] with band ratioing, % reflectance of first capture band with no IR correction and no band ratioing and % reflectance of first capture band with no band ratioing but with IR correction) are compared.


Claims (22)
- A method for determining the concentration of an analyte in a sample of body fluid which comprises the steps of:a) providing a test matrix through which the fluid sample can flow by capillarity, said strip having a first region which contains mobile specific binding partner for the analyte which binding partner bears a detectable label and can react with the analyte to form an analyte/labeled binding partner complex, at least one second region which contains immobilized analyte or an immobilized binding partner which is specific for an epitope of the analyte different than that to which the labeled binding partner is specific, at least one third region which contains means for capturing the analyte/labeled specific binding partner complex which is not bound in the second region and a fourth region which contains means for producing a detectable signal the intensity of which corresponds to the level of a second analyte whose concentration is clinically related to that of the first analyte whose concentration is being determined;b) developing the matrix by applying a sample of a body fluid suspected of containing the first and second analytes thereto thereby allowing it to contact the labeled specific binding partner so that analyte present in the fluid sample binds to the labeled specific binding partner to form a complex while leaving excess, unreacted labeled binding partner free to further react whereby the fluid sample carries the analyte/labeled binding partner complex and unreacted labeled binding partner along the matrix by capillarity to the second region containing the immobilized analyte in which region unreacted labeled binding partner is bound to the immobilized analyte in inverse relationship to the concentration of the first analyte in the fluid test sample or is bound to the immobilized specific binding partner in a direct relationship to the concentration of analyte in the fluid test sample; and the labeled specific binding partner which did not bind to the second region is carried by capillarity to the third region where it is immobilized by the immobilization means;c) reading the second region of the developed matrix on an instrument having a detector capable of measuring the signal from the detectable label to determine the concentration of the labeled binding partner in the second zone and reading the third zone of the developed strip in a similar manner to determine the signal from the labeled binding partner in the third zone of the matrix;d) determining the final response signal by ratioing the signals from the labeled binding partner captured in the second region and the labeled binding partner immobilized in the third region;e) determining the concentration of the first analyte in the fluid sample by comparing the final response signal determined in step d with final response signals determined in a similar manner for fluid samples containing known concentrations of the first analyte;
andf) correcting the concentration of first analyte determined in step e by determining the concentration of the second analyte in the fluid test sample by measuring the intensity of the signal in the fourth region of the strip and then determining the ratio of the second analyte to the first analyte whose quantitative concentration is being sought. - The method of Claim 1 wherein the body fluid is urine, whole blood, plasma, serum, sweat or saliva.
- The method of Claim 2 wherein the body fluid is whole blood, the first analyte is HbA1c and the second analyte is total hemoglobin.
- The method of Claim 2 wherein the body fluid is serum, the first analyte is transerrin and the second analyte is transferring-iron binding capacity.
- The method of Claim 2 wherein the body fluid is urine, the first analyte is a urine borne substance and the second analyte is a material whose concentration is a measure of renal clearance.
- The method of Claim 5 wherein the second analyte is creatinine or inulin.
- The method of Claim 6 wherein the first analyte is deoxypyridinoline, human serum albumin, amphetamines, barbituates, cocaine, prostate specific antigen, lactate dehydrogenase, N-acetyl-B-D-glucosamindase, human chorionic gonadotropin, follicle stimulating hormone, lutenizing hormone, Tamm-Horsfall protein, lipopolysaccharide, beta-2-microglobulin, amylase and chlamydial LPS.
- The method of Claim 2 wherein the body fluid is whole blood or serum, the first analyte is total prostate specific antigen and the second analyte is free prostate specific antigen.
- The method of Claim 1 wherein the first analyte is alanine aminotransferase and the second analyte is aspartate aminotransferase.
- The method of Claim 1 wherein the matrix is in the form of a strip through which the fluid sample flows horizontally.
- The method of claim 1 wherein the second region of the test matrix is divided into 3 discrete bands, the third region is a single band and the final response signal is determined by solving the equation:
- The method of Claim 1 wherein the second and third regions of the test matrix are divided into multiple capture and detection bands respectively and the final response signal is determined by solving the equation:
- The method of Claim 1 wherein the strip is read by use of a reflectance meter which is equipped with software which is pre-programmed with the appropriate algorithm for the determination of the final response signal from reflectance signals received from the first and second regions and for the determination of the concentration of the second analyte from the reflectance signal received from the fourth region and for the determination of the ratio of the concentration of the second analyte in the sample of body fluid to the concentration of the first analyte to determine the corrected concentration of the first analyte.
- A method for the detection of the concentration of an analyte in a sample of body fluid which comprises:a) applying the body fluid to a multizoned strip having a first zone which contains mobile specific binding partner for the analyte which binding partner bears a visually detectable label and can react with the analyte to form an analyte/labeled specific binding partner complex, at least one second region which contains immobilized analyte or an immobilized binding partner for an epitope of the analyte different than that to which the labeled specific binding partner is specific and at least one third region which contains means for capturing the analyte/labeled specific binding partner complex which is not bound in the second region;b) determining the amount of labeled specific binding partner captured in the second region(s) by means of a reflectance meter which is able to detect reflectance at a wavelength at which the visible label reflects light and determining the amount of analyte/labeled specific binding partner complex is immobilized in the third region(s) in a similar manner;c) determining a final response signal by ratioing the reflectance signals from the labeled specific binding partner captured in the second region(s) and the labeled binding partner immobilized in the third region(s) using an algorithm and a number of second and third regions chosen in a manner which provides a final response signal that can be read with enhanced precision by the reflectance meter;d) determining the concentration of the analyte by comparing the final response signal with final response signals determined in the same manner for body fluid samples containing known concentrations of the analyte.
- The method of Claim 1 wherein the second region of the strip is divided in to 3 bands, the third region is a single band and the final response signal is determined by solving the equation:
- The method of Claim 1 wherein the second and third regions of the test strip are divided into multiple capture and detection bands respectively and the final response signal is determined by solving the equation:
- The method of Claim 14 wherein the strip contains a fourth region which contains means for producing a visually detectable signal, the intensity of which corresponds to the level of a second analyte in the body fluid whose concentration is clinically related to that of the analyte whose concentration is being determined and wherein the final response signal is corrected by determining the ratio of the analyte whose concentration is being sought to the second analyte.
- The method of Claim 1 wherein the body fluid is urine and the analyte is deoxypyridinoline.
- The method of Claim 17 wherein the body fluid is urine, the first analyte is a urine borne substance and the second analyte is a material whose concentration is a measure of renal clearance.
- The method of Claim 5 wherein the second analyte is creatinine.
- The method of Claim 14 wherein the strip is read by use of a reflectance meter which is equipped with software which is pre-programmed with the appropriate algorithm for the determination of the final response signal from the reflectance signals received from the second and third regions.
- The method of Claim 21 wherein the strip contains a fourth region which contains means for producing a spectrometrically detectable signal, the intensity of which corresponds to the level of a second analyte in the body fluid whose concentration is clinically related to that of the analyte whose concentration is being determined and the reflectance meter is equipped with software which is preprogrammed for the determination of the concentration of the analyte based on the reflection from the fourth region and for the determination of the ratio of the concentration of the second analyte to that of the first analyte as determined from the final response signal to determine the corrected concentration of the first analyte.
Applications Claiming Priority (2)
| Application Number | Priority Date | Filing Date | Title |
|---|---|---|---|
| US900586 | 1986-08-26 | ||
| US08/900,586 US6436721B1 (en) | 1997-07-25 | 1997-07-25 | Device and method for obtaining clinically significant analyte ratios |
Publications (3)
| Publication Number | Publication Date |
|---|---|
| EP0895084A2 true EP0895084A2 (en) | 1999-02-03 |
| EP0895084A3 EP0895084A3 (en) | 2000-03-15 |
| EP0895084B1 EP0895084B1 (en) | 2004-09-29 |
Family
ID=25412759
Family Applications (1)
| Application Number | Title | Priority Date | Filing Date |
|---|---|---|---|
| EP98112964A Expired - Lifetime EP0895084B1 (en) | 1997-07-25 | 1998-07-13 | Device and method for obtaining clinically significant analyte ratios |
Country Status (7)
| Country | Link |
|---|---|
| US (1) | US6436721B1 (en) |
| EP (1) | EP0895084B1 (en) |
| JP (1) | JP4183308B2 (en) |
| AU (1) | AU729380B2 (en) |
| CA (1) | CA2236135A1 (en) |
| DE (1) | DE69826583T2 (en) |
| ES (1) | ES2229421T3 (en) |
Cited By (10)
| Publication number | Priority date | Publication date | Assignee | Title |
|---|---|---|---|---|
| EP0909953A2 (en) * | 1997-10-14 | 1999-04-21 | Bayer Corporation | Method for improving the accuracy of the semi-quantitative determination of analyte in fluid samples |
| WO1999045140A1 (en) * | 1998-03-03 | 1999-09-10 | Pepex Biomedical, Llc | Apparatus for monitoring a level of a chemical species in a body fluid |
| WO2000000826A1 (en) * | 1998-06-30 | 2000-01-06 | Cambridge Sensors Limited | Immunometric assay |
| EP0987551A3 (en) * | 1998-07-27 | 2000-04-12 | Bayer Corporation | Method for the determination of analyte concentration in a lateral flow sandwich immunoassay exhibiting high-dose hook effect |
| EP1046913A2 (en) * | 1999-04-22 | 2000-10-25 | Bayer Corporation | Immunochromatographic assay |
| EP1113263A2 (en) | 1999-12-23 | 2001-07-04 | Roche Diagnostics Corporation | Microsphere containing sensor |
| EP1489420A1 (en) * | 2002-03-07 | 2004-12-22 | Enbiotec Laboratories Co., Ltd. | Instruments for detecting low-molecular weight substance |
| WO2006013329A1 (en) * | 2004-08-06 | 2006-02-09 | Inverness Medical Switzerland Gmbh | Assay device & method |
| US7192784B2 (en) * | 2000-05-08 | 2007-03-20 | Matsushita Electric Industrial Co., Ltd. | Method of measurement in chromatography |
| WO2014164633A1 (en) | 2013-03-12 | 2014-10-09 | Epinex Diagnostics, Inc. | Rapid test for urine albumin and urine creatinine |
Families Citing this family (80)
| Publication number | Priority date | Publication date | Assignee | Title |
|---|---|---|---|---|
| US6036924A (en) | 1997-12-04 | 2000-03-14 | Hewlett-Packard Company | Cassette of lancet cartridges for sampling blood |
| US6391005B1 (en) | 1998-03-30 | 2002-05-21 | Agilent Technologies, Inc. | Apparatus and method for penetration with shaft having a sensor for sensing penetration depth |
| AUPP713498A0 (en) * | 1998-11-17 | 1998-12-10 | Chandler, Howard Milne | A method of detecting blood |
| US8641644B2 (en) | 2000-11-21 | 2014-02-04 | Sanofi-Aventis Deutschland Gmbh | Blood testing apparatus having a rotatable cartridge with multiple lancing elements and testing means |
| US20030162236A1 (en) * | 2001-03-26 | 2003-08-28 | Response Biomedical Corporation | Compensation for variability in specific binding in quantitative assays |
| WO2002100254A2 (en) | 2001-06-12 | 2002-12-19 | Pelikan Technologies, Inc. | Method and apparatus for lancet launching device integrated onto a blood-sampling cartridge |
| US9226699B2 (en) | 2002-04-19 | 2016-01-05 | Sanofi-Aventis Deutschland Gmbh | Body fluid sampling module with a continuous compression tissue interface surface |
| ES2352998T3 (en) | 2001-06-12 | 2011-02-24 | Pelikan Technologies Inc. | LANCETA ELECTRIC ACTUATOR. |
| US8337419B2 (en) | 2002-04-19 | 2012-12-25 | Sanofi-Aventis Deutschland Gmbh | Tissue penetration device |
| CA2448902C (en) | 2001-06-12 | 2010-09-07 | Pelikan Technologies, Inc. | Self optimizing lancing device with adaptation means to temporal variations in cutaneous properties |
| AU2002344825A1 (en) | 2001-06-12 | 2002-12-23 | Pelikan Technologies, Inc. | Method and apparatus for improving success rate of blood yield from a fingerstick |
| US9427532B2 (en) | 2001-06-12 | 2016-08-30 | Sanofi-Aventis Deutschland Gmbh | Tissue penetration device |
| CA2448905C (en) | 2001-06-12 | 2010-09-07 | Pelikan Technologies, Inc. | Blood sampling apparatus and method |
| US7981056B2 (en) | 2002-04-19 | 2011-07-19 | Pelikan Technologies, Inc. | Methods and apparatus for lancet actuation |
| US9795747B2 (en) | 2010-06-02 | 2017-10-24 | Sanofi-Aventis Deutschland Gmbh | Methods and apparatus for lancet actuation |
| US7025774B2 (en) | 2001-06-12 | 2006-04-11 | Pelikan Technologies, Inc. | Tissue penetration device |
| US7175992B2 (en) * | 2002-04-10 | 2007-02-13 | Response Biomedical Corporation | Sensitive immunochromatographic assay |
| CN1646913B (en) * | 2002-04-10 | 2013-06-19 | 反应生物医学公司 | Sensitive immunochromatographic assay |
| US7229458B2 (en) | 2002-04-19 | 2007-06-12 | Pelikan Technologies, Inc. | Method and apparatus for penetrating tissue |
| US7547287B2 (en) | 2002-04-19 | 2009-06-16 | Pelikan Technologies, Inc. | Method and apparatus for penetrating tissue |
| US8267870B2 (en) | 2002-04-19 | 2012-09-18 | Sanofi-Aventis Deutschland Gmbh | Method and apparatus for body fluid sampling with hybrid actuation |
| US7232451B2 (en) | 2002-04-19 | 2007-06-19 | Pelikan Technologies, Inc. | Method and apparatus for penetrating tissue |
| US7175642B2 (en) | 2002-04-19 | 2007-02-13 | Pelikan Technologies, Inc. | Methods and apparatus for lancet actuation |
| US7717863B2 (en) | 2002-04-19 | 2010-05-18 | Pelikan Technologies, Inc. | Method and apparatus for penetrating tissue |
| US8360992B2 (en) | 2002-04-19 | 2013-01-29 | Sanofi-Aventis Deutschland Gmbh | Method and apparatus for penetrating tissue |
| US7674232B2 (en) | 2002-04-19 | 2010-03-09 | Pelikan Technologies, Inc. | Method and apparatus for penetrating tissue |
| US9314194B2 (en) | 2002-04-19 | 2016-04-19 | Sanofi-Aventis Deutschland Gmbh | Tissue penetration device |
| US7892183B2 (en) | 2002-04-19 | 2011-02-22 | Pelikan Technologies, Inc. | Method and apparatus for body fluid sampling and analyte sensing |
| US8221334B2 (en) | 2002-04-19 | 2012-07-17 | Sanofi-Aventis Deutschland Gmbh | Method and apparatus for penetrating tissue |
| US9248267B2 (en) | 2002-04-19 | 2016-02-02 | Sanofi-Aventis Deustchland Gmbh | Tissue penetration device |
| US7901362B2 (en) | 2002-04-19 | 2011-03-08 | Pelikan Technologies, Inc. | Method and apparatus for penetrating tissue |
| US7491178B2 (en) | 2002-04-19 | 2009-02-17 | Pelikan Technologies, Inc. | Method and apparatus for penetrating tissue |
| US8372016B2 (en) | 2002-04-19 | 2013-02-12 | Sanofi-Aventis Deutschland Gmbh | Method and apparatus for body fluid sampling and analyte sensing |
| US7297122B2 (en) | 2002-04-19 | 2007-11-20 | Pelikan Technologies, Inc. | Method and apparatus for penetrating tissue |
| US7648468B2 (en) | 2002-04-19 | 2010-01-19 | Pelikon Technologies, Inc. | Method and apparatus for penetrating tissue |
| US8579831B2 (en) | 2002-04-19 | 2013-11-12 | Sanofi-Aventis Deutschland Gmbh | Method and apparatus for penetrating tissue |
| US8702624B2 (en) | 2006-09-29 | 2014-04-22 | Sanofi-Aventis Deutschland Gmbh | Analyte measurement device with a single shot actuator |
| US7976476B2 (en) | 2002-04-19 | 2011-07-12 | Pelikan Technologies, Inc. | Device and method for variable speed lancet |
| US7909778B2 (en) | 2002-04-19 | 2011-03-22 | Pelikan Technologies, Inc. | Method and apparatus for penetrating tissue |
| US7291117B2 (en) | 2002-04-19 | 2007-11-06 | Pelikan Technologies, Inc. | Method and apparatus for penetrating tissue |
| US7713214B2 (en) | 2002-04-19 | 2010-05-11 | Pelikan Technologies, Inc. | Method and apparatus for a multi-use body fluid sampling device with optical analyte sensing |
| US9795334B2 (en) | 2002-04-19 | 2017-10-24 | Sanofi-Aventis Deutschland Gmbh | Method and apparatus for penetrating tissue |
| US8784335B2 (en) | 2002-04-19 | 2014-07-22 | Sanofi-Aventis Deutschland Gmbh | Body fluid sampling device with a capacitive sensor |
| US7331931B2 (en) | 2002-04-19 | 2008-02-19 | Pelikan Technologies, Inc. | Method and apparatus for penetrating tissue |
| US7371247B2 (en) | 2002-04-19 | 2008-05-13 | Pelikan Technologies, Inc | Method and apparatus for penetrating tissue |
| US8574895B2 (en) | 2002-12-30 | 2013-11-05 | Sanofi-Aventis Deutschland Gmbh | Method and apparatus using optical techniques to measure analyte levels |
| ATE449962T1 (en) * | 2003-02-05 | 2009-12-15 | Gen Hospital Corp | MICROCHIP-BASED SYSTEM FOR HIV DIAGNOSTICS |
| EP1616023A4 (en) * | 2003-03-21 | 2011-12-21 | Government Of The Usa Represented By The Dept Of Health And Human Services Ct S For Disease Control | Finding usable portion of sigmoid curve |
| WO2004089187A2 (en) * | 2003-04-01 | 2004-10-21 | University Of Southern California | Caries risk test for predicting and assessing the risk of disease |
| EP2238892A3 (en) | 2003-05-30 | 2011-02-09 | Pelikan Technologies Inc. | Apparatus for body fluid sampling |
| US8101429B2 (en) * | 2003-06-03 | 2012-01-24 | Siemens Healthcare Diagnostics Inc. | Native analyte as a reference in lateral flow assays |
| US7850621B2 (en) | 2003-06-06 | 2010-12-14 | Pelikan Technologies, Inc. | Method and apparatus for body fluid sampling and analyte sensing |
| WO2006001797A1 (en) | 2004-06-14 | 2006-01-05 | Pelikan Technologies, Inc. | Low pain penetrating |
| WO2005033659A2 (en) | 2003-09-29 | 2005-04-14 | Pelikan Technologies, Inc. | Method and apparatus for an improved sample capture device |
| WO2005037095A1 (en) | 2003-10-14 | 2005-04-28 | Pelikan Technologies, Inc. | Method and apparatus for a variable user interface |
| US8668656B2 (en) | 2003-12-31 | 2014-03-11 | Sanofi-Aventis Deutschland Gmbh | Method and apparatus for improving fluidic flow and sample capture |
| US7822454B1 (en) | 2005-01-03 | 2010-10-26 | Pelikan Technologies, Inc. | Fluid sampling device with improved analyte detecting member configuration |
| EP1751546A2 (en) | 2004-05-20 | 2007-02-14 | Albatros Technologies GmbH & Co. KG | Printable hydrogel for biosensors |
| WO2005120365A1 (en) | 2004-06-03 | 2005-12-22 | Pelikan Technologies, Inc. | Method and apparatus for a fluid sampling device |
| US9775553B2 (en) | 2004-06-03 | 2017-10-03 | Sanofi-Aventis Deutschland Gmbh | Method and apparatus for a fluid sampling device |
| DK2299275T3 (en) | 2004-07-30 | 2018-05-07 | Adeza Biomedical Corp | Classification of oncofetal fetronectin level for pregnancy-related indications |
| CA2588230A1 (en) * | 2004-11-23 | 2006-08-10 | Response Biomedical Corporation | Immunoassay employing two-step internal calibration reaction |
| US8652831B2 (en) | 2004-12-30 | 2014-02-18 | Sanofi-Aventis Deutschland Gmbh | Method and apparatus for analyte measurement test time |
| EP1849001B1 (en) * | 2005-02-18 | 2016-04-06 | Charm Sciences, Inc. | Lateral flow test kit and method for detecting an analyte |
| US8709792B2 (en) * | 2005-02-18 | 2014-04-29 | Charm Sciences, Inc. | Lateral flow test kit and method for detecting an analyte |
| JP4750052B2 (en) * | 2007-02-07 | 2011-08-17 | パナソニック株式会社 | Measuring method using biosensor |
| CA2677977C (en) * | 2007-02-26 | 2015-03-31 | Response Biomedical Corporation | Comparative multiple analyte assay |
| GB2450351B (en) | 2007-06-20 | 2012-01-18 | Cozart Bioscience Ltd | Monitoring an Immunoassay |
| US9386944B2 (en) | 2008-04-11 | 2016-07-12 | Sanofi-Aventis Deutschland Gmbh | Method and apparatus for analyte detecting device |
| JP4600787B2 (en) * | 2008-06-18 | 2010-12-15 | アイシン精機株式会社 | Chromatographic device |
| US8260556B2 (en) * | 2008-08-21 | 2012-09-04 | Bio-Rad Laboratories, Inc. | Calibration surface method for determination on of analyte ratios |
| US8446463B2 (en) | 2008-08-22 | 2013-05-21 | Genprime, Inc. | Apparatus, method and article to perform assays using assay strips |
| JP4722977B2 (en) * | 2008-08-27 | 2011-07-13 | シャープ株式会社 | Detection instrument, analyzer, detection method, and control method of detection instrument |
| US9375169B2 (en) | 2009-01-30 | 2016-06-28 | Sanofi-Aventis Deutschland Gmbh | Cam drive for managing disposable penetrating member actions with a single motor and motor and control system |
| US8965476B2 (en) | 2010-04-16 | 2015-02-24 | Sanofi-Aventis Deutschland Gmbh | Tissue penetration device |
| US8620590B2 (en) | 2010-09-30 | 2013-12-31 | Bio-Rad Laboratories, Inc. | Dose surface method for determination of analyte ratios |
| ES2686542T3 (en) * | 2012-10-18 | 2018-10-18 | Metanomics Gmbh | Means and procedures for determining a standard amount of clearance of a biomarker of metabolic disease in a sample |
| CN110412265B (en) | 2012-11-15 | 2023-04-11 | 奥索临床诊断有限公司 | Calibration assays using reaction time |
| US10576475B2 (en) | 2016-09-15 | 2020-03-03 | Genprime, Inc. | Diagnostic assay strip cassette |
| RU2712249C1 (en) * | 2018-11-28 | 2020-01-27 | Общество С Ограниченной Ответственностью "Синтэко-Групп" | Quantitative immunochromatographic analysis method |
Citations (9)
| Publication number | Priority date | Publication date | Assignee | Title |
|---|---|---|---|---|
| FR2667943A1 (en) * | 1990-10-11 | 1992-04-17 | Toledano Jacques | Device and procedure for the rapid qualitative and quantitative determination of a ligand in a fluid |
| EP0525723A2 (en) * | 1991-07-29 | 1993-02-03 | Mochida Pharmaceutical Co., Ltd. | Process and device for specific binding assay |
| WO1993015230A1 (en) * | 1992-01-22 | 1993-08-05 | Abbott Laboratories | Calibration reagents for semi-quantitative binding assays and devices |
| EP0595641A2 (en) * | 1992-10-30 | 1994-05-04 | Becton, Dickinson and Company | One-step simultaneous immunoassay |
| US5569608A (en) * | 1995-01-30 | 1996-10-29 | Bayer Corporation | Quantitative detection of analytes on immunochromatographic strips |
| WO1996034271A1 (en) * | 1995-04-27 | 1996-10-31 | Quidel Corporation | One step urine creatinine assays |
| EP0813064A1 (en) * | 1996-06-10 | 1997-12-17 | Bayer Corporation | Method for amplification of the response signal in a sandwich immunoassay |
| EP0889327A1 (en) * | 1997-06-30 | 1999-01-07 | Bayer Corporation | Method for the detection of an analyte by immunochromatography |
| EP0909953A2 (en) * | 1997-10-14 | 1999-04-21 | Bayer Corporation | Method for improving the accuracy of the semi-quantitative determination of analyte in fluid samples |
Family Cites Families (9)
| Publication number | Priority date | Publication date | Assignee | Title |
|---|---|---|---|---|
| US3615229A (en) * | 1969-05-26 | 1971-10-26 | Searle Reference Lab Inc | Use of oxalic acid for the hydrolysis of steroid conjugates in pregnancy analysis |
| US4446232A (en) | 1981-10-13 | 1984-05-01 | Liotta Lance A | Enzyme immunoassay with two-zoned device having bound antigens |
| US4703017C1 (en) | 1984-02-14 | 2001-12-04 | Becton Dickinson Co | Solid phase assay with visual readout |
| US5500350A (en) * | 1985-10-30 | 1996-03-19 | Celltech Limited | Binding assay device |
| US4868108A (en) | 1985-12-12 | 1989-09-19 | Hygeia Sciences, Incorporated | Multiple-antibody detection of antigen |
| US4943522A (en) | 1987-06-01 | 1990-07-24 | Quidel | Lateral flow, non-bibulous membrane assay protocols |
| ATE140794T1 (en) | 1990-05-09 | 1996-08-15 | Abbott Lab | BOND DETECTION METHOD WITH CONJUGATE RECOVERY |
| US5385847A (en) * | 1993-12-02 | 1995-01-31 | Miles Inc. | Method for the determination of urinary protein and creatinine |
| AUPM717694A0 (en) | 1994-08-01 | 1994-08-25 | Sand Institute | A test strip for the rapid quantification of urinary calcium loss |
-
1997
- 1997-07-25 US US08/900,586 patent/US6436721B1/en not_active Expired - Lifetime
-
1998
- 1998-04-29 CA CA002236135A patent/CA2236135A1/en not_active Abandoned
- 1998-07-13 ES ES98112964T patent/ES2229421T3/en not_active Expired - Lifetime
- 1998-07-13 DE DE69826583T patent/DE69826583T2/en not_active Expired - Lifetime
- 1998-07-13 EP EP98112964A patent/EP0895084B1/en not_active Expired - Lifetime
- 1998-07-22 AU AU77440/98A patent/AU729380B2/en not_active Ceased
- 1998-07-22 JP JP20619398A patent/JP4183308B2/en not_active Expired - Lifetime
Patent Citations (9)
| Publication number | Priority date | Publication date | Assignee | Title |
|---|---|---|---|---|
| FR2667943A1 (en) * | 1990-10-11 | 1992-04-17 | Toledano Jacques | Device and procedure for the rapid qualitative and quantitative determination of a ligand in a fluid |
| EP0525723A2 (en) * | 1991-07-29 | 1993-02-03 | Mochida Pharmaceutical Co., Ltd. | Process and device for specific binding assay |
| WO1993015230A1 (en) * | 1992-01-22 | 1993-08-05 | Abbott Laboratories | Calibration reagents for semi-quantitative binding assays and devices |
| EP0595641A2 (en) * | 1992-10-30 | 1994-05-04 | Becton, Dickinson and Company | One-step simultaneous immunoassay |
| US5569608A (en) * | 1995-01-30 | 1996-10-29 | Bayer Corporation | Quantitative detection of analytes on immunochromatographic strips |
| WO1996034271A1 (en) * | 1995-04-27 | 1996-10-31 | Quidel Corporation | One step urine creatinine assays |
| EP0813064A1 (en) * | 1996-06-10 | 1997-12-17 | Bayer Corporation | Method for amplification of the response signal in a sandwich immunoassay |
| EP0889327A1 (en) * | 1997-06-30 | 1999-01-07 | Bayer Corporation | Method for the detection of an analyte by immunochromatography |
| EP0909953A2 (en) * | 1997-10-14 | 1999-04-21 | Bayer Corporation | Method for improving the accuracy of the semi-quantitative determination of analyte in fluid samples |
Cited By (21)
| Publication number | Priority date | Publication date | Assignee | Title |
|---|---|---|---|---|
| EP0909953A3 (en) * | 1997-10-14 | 2000-03-15 | Bayer Corporation | Method for improving the accuracy of the semi-quantitative determination of analyte in fluid samples |
| EP0909953A2 (en) * | 1997-10-14 | 1999-04-21 | Bayer Corporation | Method for improving the accuracy of the semi-quantitative determination of analyte in fluid samples |
| GB2350190B (en) * | 1998-03-03 | 2002-02-27 | Pepex Biomedical Llc | Apparatus for monitoring a level of a chemical species in a body fluid |
| WO1999045140A1 (en) * | 1998-03-03 | 1999-09-10 | Pepex Biomedical, Llc | Apparatus for monitoring a level of a chemical species in a body fluid |
| GB2350190A (en) * | 1998-03-03 | 2000-11-22 | Pepex Biomedical Llc | Apparatus for monitoring a level of a chemical species in a body fluid |
| US6479015B1 (en) | 1998-03-03 | 2002-11-12 | Pepex Biomedical, Llc | Apparatus for monitoring a level of a chemical species in a body fluid |
| WO2000000826A1 (en) * | 1998-06-30 | 2000-01-06 | Cambridge Sensors Limited | Immunometric assay |
| EP0987551A3 (en) * | 1998-07-27 | 2000-04-12 | Bayer Corporation | Method for the determination of analyte concentration in a lateral flow sandwich immunoassay exhibiting high-dose hook effect |
| EP1046913A2 (en) * | 1999-04-22 | 2000-10-25 | Bayer Corporation | Immunochromatographic assay |
| EP1046913A3 (en) * | 1999-04-22 | 2000-11-29 | Bayer Corporation | Immunochromatographic assay |
| EP1113263A2 (en) | 1999-12-23 | 2001-07-04 | Roche Diagnostics Corporation | Microsphere containing sensor |
| US6627057B1 (en) | 1999-12-23 | 2003-09-30 | Roche Diagnostic Corporation | Microsphere containing sensor |
| US7192784B2 (en) * | 2000-05-08 | 2007-03-20 | Matsushita Electric Industrial Co., Ltd. | Method of measurement in chromatography |
| EP1489420A1 (en) * | 2002-03-07 | 2004-12-22 | Enbiotec Laboratories Co., Ltd. | Instruments for detecting low-molecular weight substance |
| EP1489420A4 (en) * | 2002-03-07 | 2006-05-03 | Enbiotec Lab Co Ltd | Instruments for detecting low-molecular weight substance |
| WO2006013329A1 (en) * | 2004-08-06 | 2006-02-09 | Inverness Medical Switzerland Gmbh | Assay device & method |
| GB2431988A (en) * | 2004-08-06 | 2007-05-09 | Inverness Medical Switzerland | Assay device & method |
| WO2014164633A1 (en) | 2013-03-12 | 2014-10-09 | Epinex Diagnostics, Inc. | Rapid test for urine albumin and urine creatinine |
| CN105358986A (en) * | 2013-03-12 | 2016-02-24 | 埃皮纳克诊断公司 | Rapid test for urine albumin and urine creatinine |
| EP2972395A4 (en) * | 2013-03-12 | 2016-08-17 | Epinex Diagnostics Inc | Rapid test for urine albumin and urine creatinine |
| US9804154B2 (en) | 2013-03-12 | 2017-10-31 | Epinex Diagnostics, Inc. | Rapid test for urine albumin and urine creatinine |
Also Published As
| Publication number | Publication date |
|---|---|
| EP0895084A3 (en) | 2000-03-15 |
| AU7744098A (en) | 1999-02-04 |
| ES2229421T3 (en) | 2005-04-16 |
| CA2236135A1 (en) | 1999-01-25 |
| EP0895084B1 (en) | 2004-09-29 |
| DE69826583D1 (en) | 2004-11-04 |
| JP4183308B2 (en) | 2008-11-19 |
| AU729380B2 (en) | 2001-02-01 |
| DE69826583T2 (en) | 2006-03-09 |
| US6436721B1 (en) | 2002-08-20 |
| JPH1183856A (en) | 1999-03-26 |
Similar Documents
| Publication | Publication Date | Title |
|---|---|---|
| EP0895084B1 (en) | Device and method for obtaining clinically significant analyte ratios | |
| US5569608A (en) | Quantitative detection of analytes on immunochromatographic strips | |
| EP0987551B1 (en) | Method for the determination of analyte concentration in a lateral flow sandwich immunoassay exhibiting high-dose hook effect | |
| US6844200B2 (en) | Device for carrying out lateral-flow assays involving more than one analyte | |
| EP1634078B1 (en) | Native analyte as reference in lateral flow assays | |
| US20120028245A1 (en) | Quantitative analyte assay device and method | |
| US20060246522A1 (en) | C-reactive protein immunoassay and method | |
| EP0902287B1 (en) | Method and test strip for reducing urea effect of immunochromatographic assays using urine samples | |
| EP0909953B1 (en) | Method for improving the accuracy of the semi-quantitative determination of analyte in fluid samples | |
| US8101429B2 (en) | Native analyte as a reference in lateral flow assays | |
| EP1540343B1 (en) | Method for the elimination of interferences in immunochromatographic assays | |
| CA2198948A1 (en) | Quantitative detection of analytes on immunochromatographic strips | |
| WO1992018869A1 (en) | Colorfast reference device for immunoassays | |
| MXPA98008456A (en) | Method to improve the accuracy of the semicuantitative determination of analyte in flui samples |
Legal Events
| Date | Code | Title | Description |
|---|---|---|---|
| PUAI | Public reference made under article 153(3) epc to a published international application that has entered the european phase |
Free format text: ORIGINAL CODE: 0009012 |
|
| AK | Designated contracting states |
Kind code of ref document: A2 Designated state(s): BE CH DE ES FI FR GB IE IT LI NL SE |
|
| AX | Request for extension of the european patent |
Free format text: AL;LT;LV;MK;RO;SI |
|
| PUAL | Search report despatched |
Free format text: ORIGINAL CODE: 0009013 |
|
| AK | Designated contracting states |
Kind code of ref document: A3 Designated state(s): AT BE CH CY DE DK ES FI FR GB GR IE IT LI LU MC NL PT SE |
|
| AX | Request for extension of the european patent |
Free format text: AL;LT;LV;MK;RO;SI |
|
| 17P | Request for examination filed |
Effective date: 20000915 |
|
| AKX | Designation fees paid |
Free format text: BE CH DE ES FI FR GB IE IT LI NL SE |
|
| 17Q | First examination report despatched |
Effective date: 20030224 |
|
| GRAP | Despatch of communication of intention to grant a patent |
Free format text: ORIGINAL CODE: EPIDOSNIGR1 |
|
| GRAS | Grant fee paid |
Free format text: ORIGINAL CODE: EPIDOSNIGR3 |
|
| GRAA | (expected) grant |
Free format text: ORIGINAL CODE: 0009210 |
|
| AK | Designated contracting states |
Kind code of ref document: B1 Designated state(s): BE CH DE ES FI FR GB IE IT LI NL SE |
|
| REG | Reference to a national code |
Ref country code: GB Ref legal event code: FG4D |
|
| REG | Reference to a national code |
Ref country code: CH Ref legal event code: NV Representative=s name: E. BLUM & CO. PATENTANWAELTE Ref country code: CH Ref legal event code: EP |
|
| REG | Reference to a national code |
Ref country code: IE Ref legal event code: FG4D |
|
| REF | Corresponds to: |
Ref document number: 69826583 Country of ref document: DE Date of ref document: 20041104 Kind code of ref document: P |
|
| REG | Reference to a national code |
Ref country code: SE Ref legal event code: TRGR |
|
| REG | Reference to a national code |
Ref country code: ES Ref legal event code: FG2A Ref document number: 2229421 Country of ref document: ES Kind code of ref document: T3 |
|
| PGFP | Annual fee paid to national office [announced via postgrant information from national office to epo] |
Ref country code: NL Payment date: 20050616 Year of fee payment: 8 |
|
| PGFP | Annual fee paid to national office [announced via postgrant information from national office to epo] |
Ref country code: SE Payment date: 20050720 Year of fee payment: 8 |
|
| PGFP | Annual fee paid to national office [announced via postgrant information from national office to epo] |
Ref country code: FI Payment date: 20050721 Year of fee payment: 8 Ref country code: CH Payment date: 20050721 Year of fee payment: 8 |
|
| ET | Fr: translation filed | ||
| PLBE | No opposition filed within time limit |
Free format text: ORIGINAL CODE: 0009261 |
|
| STAA | Information on the status of an ep patent application or granted ep patent |
Free format text: STATUS: NO OPPOSITION FILED WITHIN TIME LIMIT |
|
| PGFP | Annual fee paid to national office [announced via postgrant information from national office to epo] |
Ref country code: BE Payment date: 20050819 Year of fee payment: 8 |
|
| 26N | No opposition filed |
Effective date: 20050630 |
|
| PG25 | Lapsed in a contracting state [announced via postgrant information from national office to epo] |
Ref country code: FI Free format text: LAPSE BECAUSE OF NON-PAYMENT OF DUE FEES Effective date: 20060713 |
|
| PG25 | Lapsed in a contracting state [announced via postgrant information from national office to epo] |
Ref country code: SE Free format text: LAPSE BECAUSE OF NON-PAYMENT OF DUE FEES Effective date: 20060714 |
|
| PGFP | Annual fee paid to national office [announced via postgrant information from national office to epo] |
Ref country code: IE Payment date: 20060717 Year of fee payment: 9 |
|
| PG25 | Lapsed in a contracting state [announced via postgrant information from national office to epo] |
Ref country code: LI Free format text: LAPSE BECAUSE OF NON-PAYMENT OF DUE FEES Effective date: 20060731 Ref country code: CH Free format text: LAPSE BECAUSE OF NON-PAYMENT OF DUE FEES Effective date: 20060731 Ref country code: BE Free format text: LAPSE BECAUSE OF NON-PAYMENT OF DUE FEES Effective date: 20060731 |
|
| PG25 | Lapsed in a contracting state [announced via postgrant information from national office to epo] |
Ref country code: NL Free format text: LAPSE BECAUSE OF NON-PAYMENT OF DUE FEES Effective date: 20070201 |
|
| REG | Reference to a national code |
Ref country code: CH Ref legal event code: PL |
|
| EUG | Se: european patent has lapsed | ||
| NLV4 | Nl: lapsed or anulled due to non-payment of the annual fee |
Effective date: 20070201 |
|
| BERE | Be: lapsed |
Owner name: *BAYER CORP. Effective date: 20060731 |
|
| REG | Reference to a national code |
Ref country code: IE Ref legal event code: MM4A |
|
| PG25 | Lapsed in a contracting state [announced via postgrant information from national office to epo] |
Ref country code: IE Free format text: LAPSE BECAUSE OF NON-PAYMENT OF DUE FEES Effective date: 20070713 |
|
| PGFP | Annual fee paid to national office [announced via postgrant information from national office to epo] |
Ref country code: IT Payment date: 20100728 Year of fee payment: 13 |
|
| REG | Reference to a national code |
Ref country code: GB Ref legal event code: 732E Free format text: REGISTERED BETWEEN 20101104 AND 20101110 |
|
| REG | Reference to a national code |
Ref country code: FR Ref legal event code: TP |
|
| PG25 | Lapsed in a contracting state [announced via postgrant information from national office to epo] |
Ref country code: IT Free format text: LAPSE BECAUSE OF NON-PAYMENT OF DUE FEES Effective date: 20110713 |
|
| REG | Reference to a national code |
Ref country code: FR Ref legal event code: PLFP Year of fee payment: 19 |
|
| REG | Reference to a national code |
Ref country code: FR Ref legal event code: PLFP Year of fee payment: 20 |
|
| PGFP | Annual fee paid to national office [announced via postgrant information from national office to epo] |
Ref country code: GB Payment date: 20170713 Year of fee payment: 20 Ref country code: DE Payment date: 20170919 Year of fee payment: 20 Ref country code: FR Payment date: 20170713 Year of fee payment: 20 |
|
| PGFP | Annual fee paid to national office [announced via postgrant information from national office to epo] |
Ref country code: ES Payment date: 20171026 Year of fee payment: 20 |
|
| REG | Reference to a national code |
Ref country code: DE Ref legal event code: R071 Ref document number: 69826583 Country of ref document: DE |
|
| REG | Reference to a national code |
Ref country code: GB Ref legal event code: PE20 Expiry date: 20180712 |
|
| PG25 | Lapsed in a contracting state [announced via postgrant information from national office to epo] |
Ref country code: GB Free format text: LAPSE BECAUSE OF EXPIRATION OF PROTECTION Effective date: 20180712 |
|
| REG | Reference to a national code |
Ref country code: ES Ref legal event code: FD2A Effective date: 20201202 |
|
| PG25 | Lapsed in a contracting state [announced via postgrant information from national office to epo] |
Ref country code: ES Free format text: LAPSE BECAUSE OF EXPIRATION OF PROTECTION Effective date: 20180714 |