LOD (Level of Detail) in Tableau
Overview
Level of Detail (LOD) in Tableau is a crucial technique for data visualization that enables users to control the granularity of analysis. LOD expressions allow you to compute values at different levels, regardless of the visualization's inherent dimensions. This helps in addressing complex data challenges, such as aggregating at specific dimensions while preserving the context of others. LOD facilitates accurate calculations for scenarios involving multiple dimensions, filters, and data sources. It empowers analysts to create more insightful visualizations by precisely defining the scope of data aggregation. By incorporating LOD, Tableau users can achieve finer control over data analysis, enhancing the clarity and depth of their visual representations.
What is LOD in Tableau?
Level of Detail (LOD) in Tableau is a powerful and advanced concept that allows users to perform complex data analysis and visualization by controlling the level of granularity at which calculations are performed. LOD expressions provide a flexible way to compute values that are not limited to the dimensions present in a particular visualization. This means that analysts can aggregate and compute data at different levels, regardless of the dimensions used in the visualization itself.
LOD expressions in Tableau come in three main types: FIXED, INCLUDE, and EXCLUDE. These expressions enable users to specify the scope of data analysis by defining the dimensions over which calculations should be performed. FIXED LOD expressions compute values using a specific set of dimensions, while INCLUDE LOD expressions incorporate dimensions from the visualization's context, and EXCLUDE LOD expressions exclude dimensions from the context.
The significance of LOD in Tableau becomes apparent when dealing with complex scenarios involving multiple dimensions, filters, and data sources. Consider a case where you want to calculate the average sales per customer while still displaying the total sales for all customers in a visualization. Using traditional aggregation methods, this would be challenging. However, with LOD expressions, you can calculate the average sales per customer (an analysis at the individual customer level) and combine it with the total sales for all customers (an analysis at the overall level) within a single visualization.
LOD expressions also help solve data blending challenges when working with data from multiple sources. By specifying how dimensions should be treated across different data sources, analysts can ensure that data is accurately aggregated and compared, even when coming from disparate databases or files.
Another critical use case for LOD is addressing data filtering intricacies. When you want to calculate a measure based on a specific filter while retaining the context of other filters, LOD expressions offer a precise solution. For instance, you can compute the top N products by sales, considering a certain date range, while still reflecting the impact of other filters like region or category.
LOD Expressions Syntax
Level of Detail (LOD) expressions in Tableau provide a way to perform calculations that are independent of the visualization's level of detail. This allows you to compute values at specific dimensions or levels, regardless of the dimensions used in the visualization itself. LOD expressions are constructed using a specific syntax that consists of keywords and operators. Here's a detailed breakdown of the syntax for LOD expressions in Tableau:
-
{FIXED [Dimension1], [Dimension2]:} - This syntax defines a FIXED LOD expression, where you specify one or more dimensions within the square brackets. The calculation is performed at the intersection of the specified dimensions, regardless of the dimensions in the view. For example, {FIXED [Category], [Region]: SUM([Sales])} calculates the sum of sales for each unique combination of Category and Region.
-
{INCLUDE [Dimension1], [Dimension2]:} - An INCLUDE LOD expression computes the value for the specified dimensions in addition to the dimensions in the view's context. This can be useful when you want to include specific dimensions in the calculation without changing the context. For instance, {INCLUDE [Product]: AVG([Profit])} calculates the average profit for each product, considering the current visualization's context.
-
{EXCLUDE [Dimension1], [Dimension2]:} - The EXCLUDE LOD expression calculates the value for the specified dimensions while excluding them from the visualization's context. It allows you to perform calculations as if the specified dimensions were not part of the view. For example, {EXCLUDE [Region]: MIN([Sales])} calculates the minimum sales amount while excluding the Region dimension.
-
{ FIXED [Dimension1], [Dimension2] : MAX( [Measure] ) } - { [Measure] } - You can also mix LOD expressions with regular aggregations. In this example, the FIXED LOD expression calculates the maximum value of a measure within the specified dimensions, and then the overall maximum across all dimensions is taken.
-
{ MIN( [Date] ) } - In this case, the calculation is done without specifying any dimensions. This computes the minimum date across the entire dataset, regardless of the visualization's context.
-
LOD Expressions with Functions: You can use various functions within LOD expressions, such as SUM(), AVG(), MIN(), MAX(), COUNT(), etc., to perform calculations on the specified dimensions or measures.
-
Conditional LOD Expressions: You can also use conditional statements within LOD expressions, such as IF-ELSE logic, to perform calculations based on certain conditions within the specified dimensions.
It's important to note that LOD expressions are computed independently from other calculations in the view, and they can significantly impact the performance of your workbook.
Therefore, understanding the syntax and effectively using LOD expressions can lead to more accurate and insightful visualizations in Tableau.
Types of LOD Expressions in Tableau
In Tableau, Level of Detail (LOD) expressions offer three main types: FIXED, INCLUDE, and EXCLUDE. These expressions enable you to control the granularity of calculations and perform advanced data analysis. Each type serves a specific purpose and provides distinct functionality. Here's a detailed overview of each type of LOD expression:
-
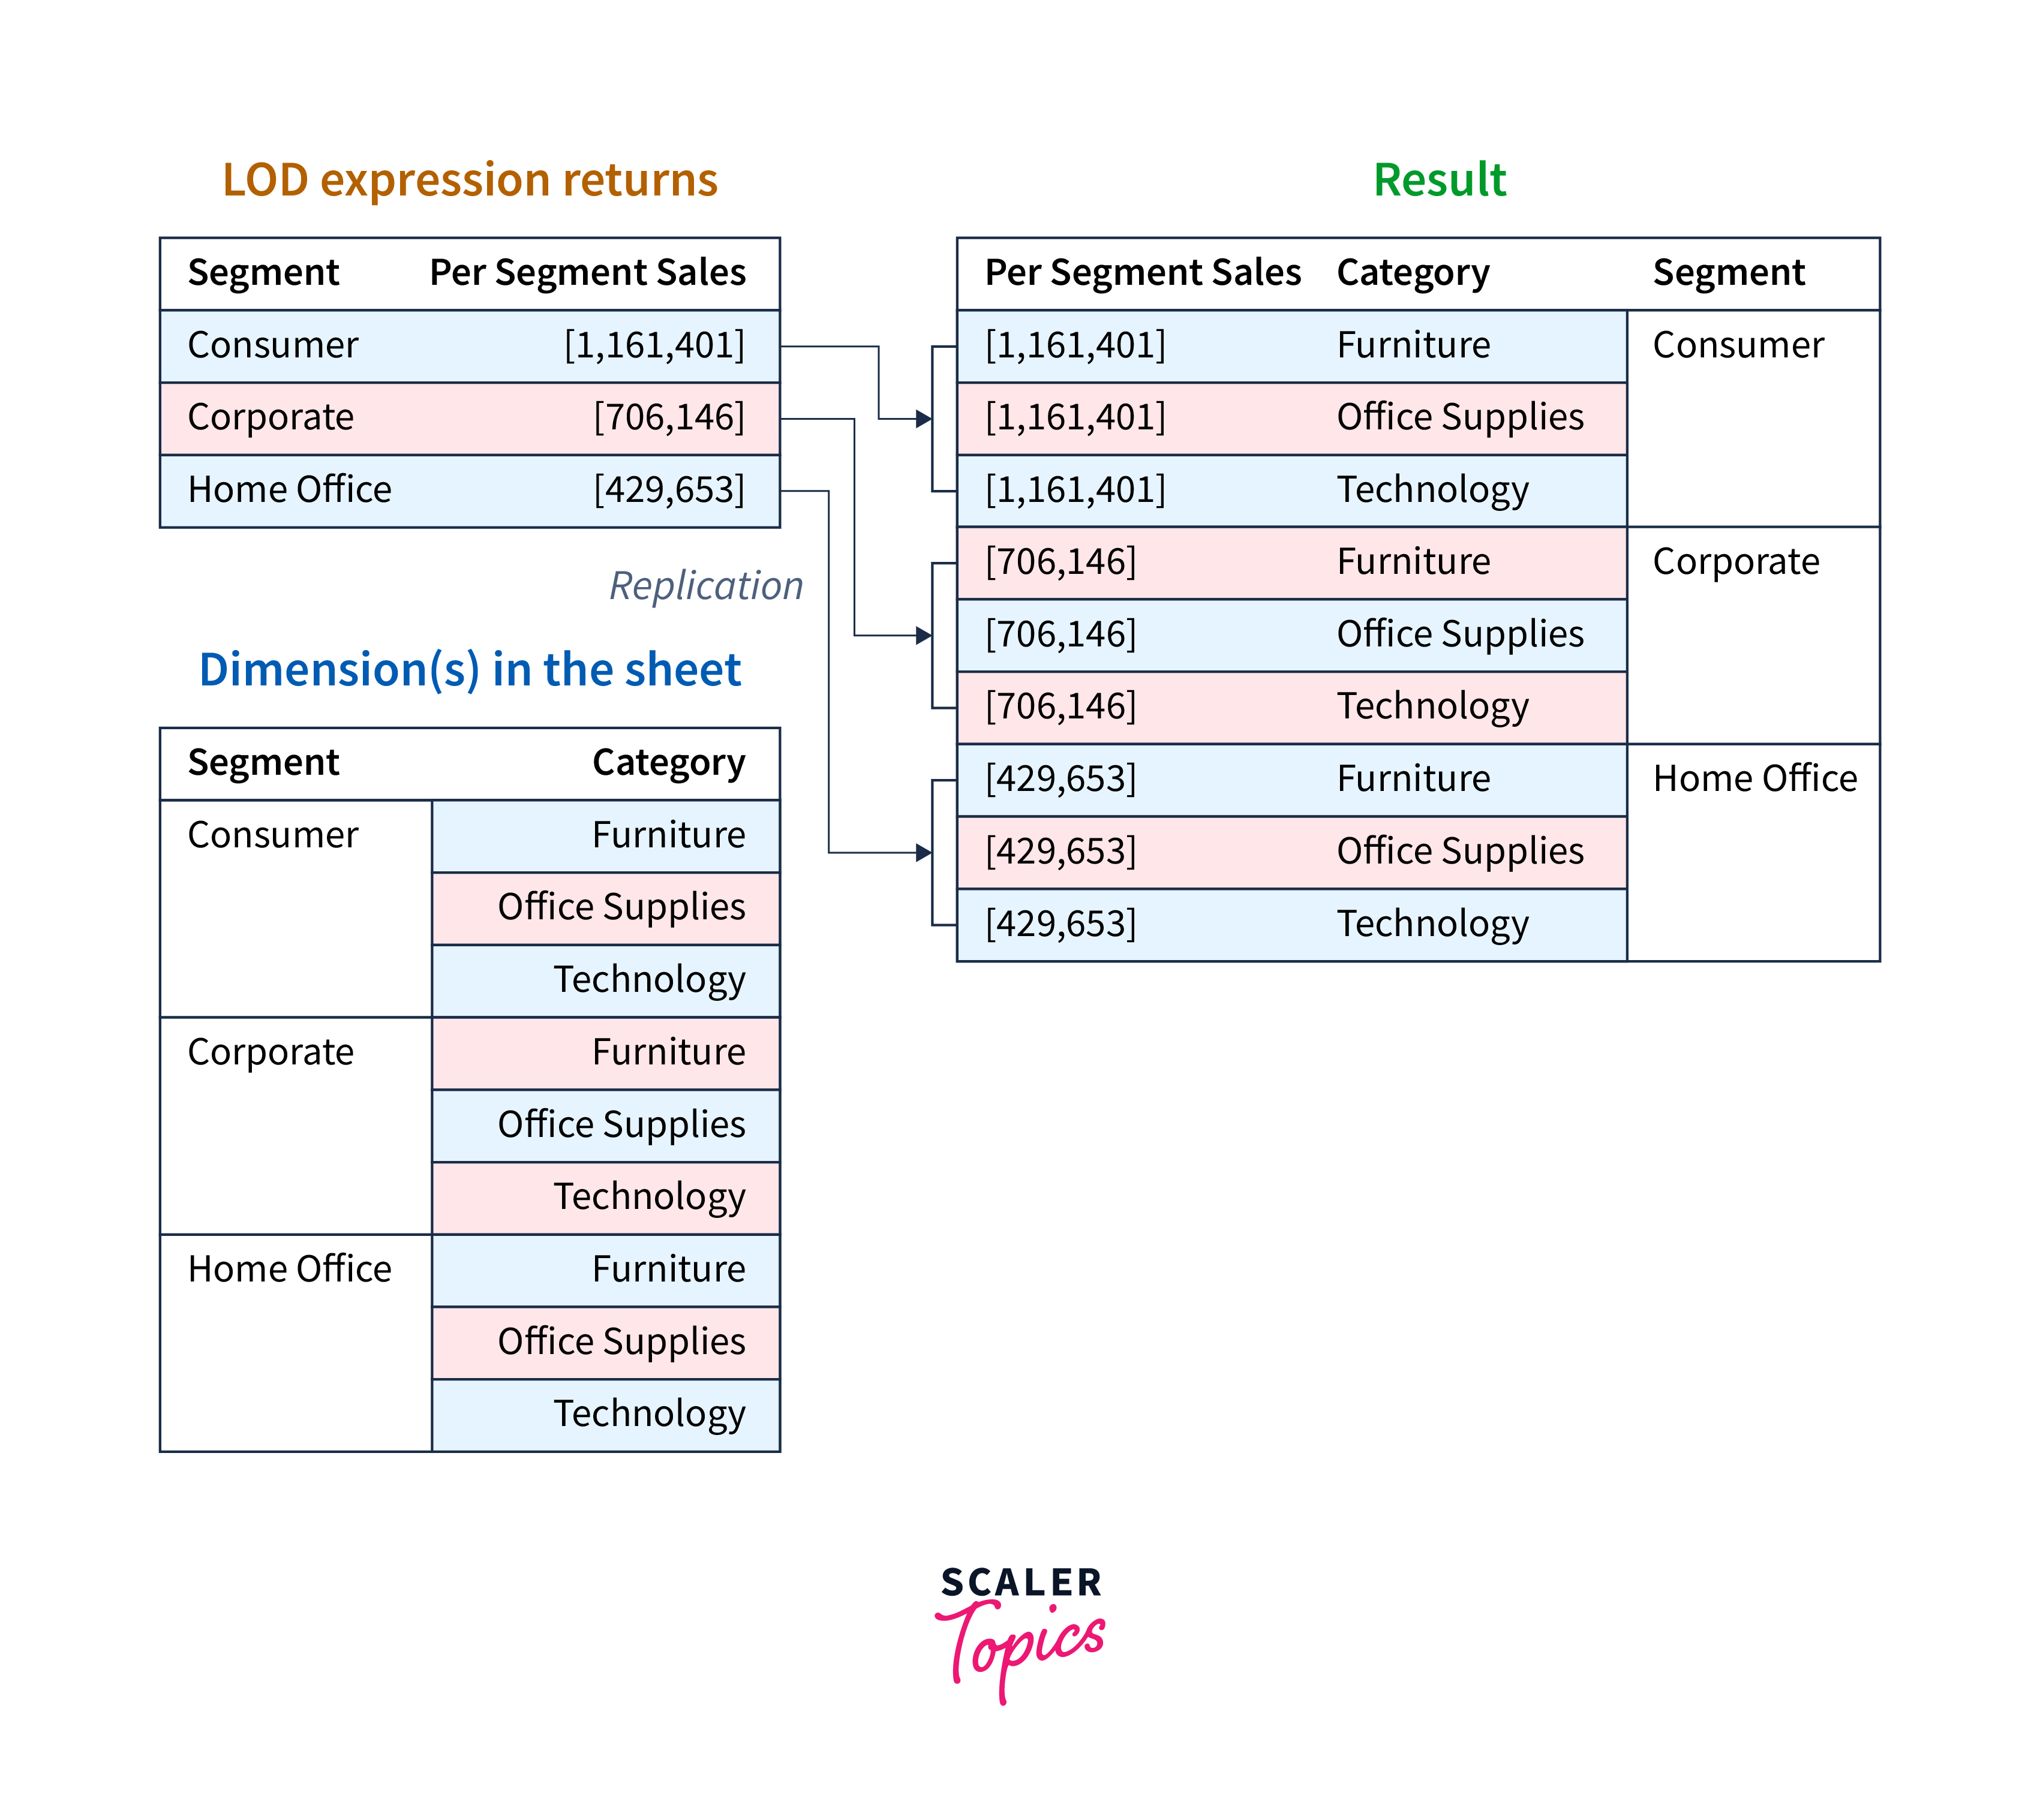
FIXED LOD Expression: The FIXED LOD expression allows you to calculate values at a specific level of detail, irrespective of the dimensions present in the visualization. It creates a temporary table that aggregates data based on the specified dimensions, and then performs calculations on that aggregated data. Syntax: {FIXED [Dimension1], [Dimension2]: AggregationFunction([Measure])}
Use Cases:
- Calculating a measure at a fixed level of detail, such as finding the average sales per category and sub-category, regardless of the other dimensions in the view.
- Comparing a measure across dimensions without changing the visualization's context, like computing the percent contribution of a product to its category's total sales.
-
INCLUDE LOD Expression: The INCLUDE LOD expression allows you to add specific dimensions to the visualization's context, calculating values at both the existing and included dimensions. This type of expression is useful when you want to introduce additional dimensions without altering the overall context of the visualization. Syntax: {INCLUDE [Dimension1], [Dimension2]: AggregationFunction([Measure])}
Use Cases:
- Evaluating a measure's performance at the individual level while keeping the original dimension's context, such as determining the average profit for products within a selected region.
- Analyzing data by including specific dimensions without disregarding other filters and dimensions in the view.
-
EXCLUDE LOD Expression: The EXCLUDE LOD expression enables you to calculate values for specific dimensions while excluding them from the visualization's context. This is helpful when you want to focus on a particular dimension while disregarding its impact on the other dimensions. Syntax: {EXCLUDE [Dimension1], [Dimension2]: AggregationFunction([Measure])}
Use Cases:
- Calculating measures while ignoring a certain dimension's influence, like computing the minimum sales per product without considering the impact of the region.
- Analyzing data by excluding particular dimensions to isolate their effects on other dimensions in the visualization.
- By understanding and utilizing these three types of LOD expressions, Tableau users can perform sophisticated analyses, address complex data challenges, and create more insightful visualizations. LOD expressions empower analysts to tailor calculations to their specific requirements, enhancing the depth and accuracy of data-driven insights.
How to Create LOD Expressions in Tableau?
Creating Level of Detail (LOD) expressions in Tableau involves defining calculations that operate independently of the visualization's existing dimensions. LOD expressions allow you to customize the granularity of your analysis. Here's a step-by-step guide on how to create LOD expressions in Tableau:
-
Open Tableau and Load Data:
- Launch Tableau Desktop and connect to your data source. Load the data that you want to analyze and visualize.
-
Create a New Worksheet:
- Once your data is loaded, create a new worksheet by clicking on the "Worksheet" tab at the bottom of the screen.
-
Identify the Use Case:
- Determine the specific analysis you want to perform using LOD expressions. Decide whether you need a FIXED, INCLUDE, or EXCLUDE LOD expression based on your use case.
-
Choose Dimensions and Measures:
- Identify the dimensions and measures you want to include in your LOD expression. These dimensions will define the scope of your calculation.
-
Write the LOD Expression:
In the "Calculations" pane, click on the "Create Calculated Field" option. This will open the calculated field editor. Write your LOD expression using the appropriate syntax:
- For FIXED LOD: {FIXED [Dimension1], [Dimension2]: AggregationFunction([Measure])}
- For INCLUDE LOD: {INCLUDE [Dimension1], [Dimension2]: AggregationFunction([Measure])}
- For EXCLUDE LOD: {EXCLUDE [Dimension1], [Dimension2]: AggregationFunction([Measure])}
- Replace [Dimension1], [Dimension2], and [Measure] with your actual dimension and measure names, and choose an aggregation function (e.g., SUM, AVG, MIN, MAX) as needed.
-
Validate and Save:
- After writing the LOD expression, click the "OK" button to close the calculated field editor. Tableau will validate the expression syntax. If there are any errors, they will be displayed in the editor for you to correct.
-
Drag Calculated Field to the Worksheet:
- Once your LOD expression is created, you can find it in the "Dimensions" or "Measures" pane. Drag the calculated field to the appropriate shelf in the worksheet (Columns, Rows, or Marks) to include it in your visualization.
-
Build Your Visualization:
- Configure your visualization using other dimensions and measures as needed. You can combine your LOD expression with other elements of the visualization to create insightful views.
-
Customize and Refine:
- Fine-tune your visualization by applying filters, sorting, and formatting options. You can also experiment with different dimensions and measures to explore your data from various angles.
-
Preview and Share:
- Preview your visualization to ensure that the LOD expression is producing the desired results. If everything looks good, save your workbook and share it with others or publish it to Tableau Server for wider access.
Creating LOD expressions in Tableau requires a solid understanding of your data and the analysis you want to perform. Experimentation and iteration are key to refining your expressions and achieving the desired insights in your visualizations.
Top LOD Expressions in Tableau
Here are some of the top Level of Detail (LOD) expressions in Tableau along with detailed explanations of how to use them:
-
Top N by Dimension with FIXED LOD:
This expression allows you to find the top N values based on a dimension, regardless of other dimensions in the view.
- Syntax: {FIXED [Dimension]: RANK([Measure]) <= N}
- Example: {FIXED [Category]: RANK(SUM([Sales])) <= 5} finds the top 5 categories by total sales.
-
Running Total by Dimension with FIXED LOD:
Calculate the running total of a measure across a specific dimension, maintaining the granularity of that dimension.
- Syntax: {FIXED [Dimension]: RUNNING_SUM([Measure])}
- Example: {FIXED [Date]: RUNNING_SUM(SUM([Sales]))} computes the cumulative sales for each date.
-
Percent of Total by Dimension with TABLE Calculation:
While not an explicit LOD expression, table calculations can achieve similar results for percentage calculations.
- Syntax: SUM([Measure]) / TOTAL(SUM([Measure]))
- Example: SUM([Sales]) / TOTAL(SUM([Sales])) calculates the percentage of total sales for each data point.
-
Difference from Overall Average with INCLUDE LOD:
Calculate the difference of a measure from the overall average, considering a specific dimension.
- Syntax: {INCLUDE [Dimension]: AVG([Measure]) - WINDOW_AVG(AVG([Measure]))}
- Example: {INCLUDE [Category]: AVG([Sales]) - WINDOW_AVG(AVG([Sales]))} calculates the difference of category sales from the overall average sales.
-
Moving Average by Dimension with WINDOW_AVG:
Compute the moving average of a measure within a specific dimension.
- Syntax: WINDOW_AVG(AVG([Measure]), -N, 0)
- Example: WINDOW_AVG(AVG([Sales]), -2, 0) calculates the 3-period moving average of sales.
-
Percentage of Total with FIXED LOD:
Calculate the percentage of a measure out of the total sum, regardless of dimensions.
- Syntax: {FIXED : SUM([Measure]) / TOTAL(SUM([Measure]))}
- Example: {FIXED : SUM([Sales]) / TOTAL(SUM([Sales]))} computes the percentage of total sales.
These are just a few examples of powerful LOD expressions in Tableau. By leveraging LOD expressions, you can perform sophisticated calculations and gain deeper insights into your data, even when dealing with complex scenarios involving multiple dimensions, filters, and data sources. Experiment with these expressions and customize them to suit your specific analysis needs.
Table vs LOD Expressions in Tableau
Both table calculations and LOD expressions have their strengths and best use cases. Table calculations are more dynamic and responsive to user interactions, while LOD expressions offer finer control over aggregation and calculations at specific levels of detail.
Understanding the differences between these two calculation methods is crucial for effectively leveraging Tableau's capabilities to create insightful visualizations and analyses.
| Table | LOD | |
|---|---|---|
| Purpose | These calculations are used to compute values based on the data displayed in a visualization. They operate on the result set after aggregation and filtering. | LOD expressions are used to perform calculations at a specific level of detail, regardless of the dimensions present in the view. They allow you to control the granularity of your analysis. |
| Granularity | They work within the existing dimensions of the view and can change dynamically with user interactions, such as filtering and sorting. | LOD expressions allow you to independently specify the dimensions for your calculations, which can differ from the view's dimensions. |
| Context | They consider the data within the visualization's context, including dimensions, filters, and sorting. | LOD expressions can define their own context, including specific dimensions, to perform calculations. |
| Usage | Useful for creating running totals, percentages of total, moving averages, and other calculations that require access to visible data points. | Suitable for complex aggregations, comparing data across different dimensions, and addressing data blending challenges. |
| Scope | Typically limited to the dimensions in the view. | Can aggregate data across different dimensions and even data sources. |
| Impact on Performance | Depending on complexity, excessive table calculations might affect performance, especially with large datasets. | Generally have a lower performance impact as they're computed before aggregation and filtering. |
| Flexibility | Highly flexible for dynamic calculations based on the view's dimensions and user interactions. | Offer more control over calculations at specific levels of detail, making them more suitable for intricate analyses. |
| Calculation Order | Computed after aggregation and filtering. | Computed before aggregation, which can affect how other aggregations and calculations are performed. |
| Use Cases | Well-suited for creating visualizations that require responsive behavior, such as interactive dashboards. | Ideal for solving complex data analysis challenges, blending data from different sources, and achieving precise aggregations. |
| Examples | Running totals, percentage of total, moving averages, rank, and window functions. | Top N by dimension, fixed-level aggregations, percentage of total ignoring certain dimensions, and complex cross-database analysis. |
Limitations of LOD Expressions
While Level of Detail (LOD) expressions in Tableau are a powerful tool for achieving advanced data analysis and visualization, they do come with certain limitations that users should be aware of. Here are some key limitations of LOD expressions in Tableau:
- Performance Impact:
- Complex LOD expressions, especially those involving large datasets, can have a noticeable impact on performance. Calculations involving LOD expressions are processed before aggregation, which can lead to increased computation times and potentially slower visualizations.
- Data Source Compatibility:
- LOD expressions may not work seamlessly with all data sources. Some data sources may not support certain features of LOD expressions, limiting their applicability in mixed-data source scenarios.
- Incompatibility with Some Calculations:
- Certain calculations and functions that work with regular dimensions and measures might not be directly applicable to LOD expressions. This can sometimes limit the flexibility and ease of calculation development.
- Filter Dependencies:
- LOD expressions are influenced by filters and context in the visualization. Complex interactions between filters and LOD expressions can lead to unexpected results or require careful consideration when building analyses.
- Complexity and Learning Curve:
- Mastering LOD expressions requires a deep understanding of the underlying data model, aggregation behavior, and syntax. They can be complex to write and troubleshoot, especially for users who are new to the concept.
- Nested Aggregation:
- LOD expressions don't support nested aggregations within the same expression. This can make certain types of calculations more challenging to achieve directly with LOD expressions.
- Data Source Blending Challenges:
- When blending data from multiple sources, LOD expressions may behave differently than anticipated due to differences in data granularity and behavior between sources.
- Aggregation Limitations:
- Some aggregation functions that involve table calculations or depend on row-level details may not be feasible to replicate using LOD expressions alone.
- Limited Contextual Awareness:
- LOD expressions may not always capture complex relationships between dimensions accurately. They might lack the context required to handle certain multidimensional scenarios.
- Interactivity Limitations:
- Unlike table calculations, LOD expressions do not respond dynamically to user interactions such as sorting and filtering. This can impact the interactivity of the visualization.
Despite these limitations, LOD expressions remain a valuable tool for achieving precise and tailored analysis in Tableau. Careful consideration of these limitations and thorough testing during the development process can help users leverage the strengths of LOD expressions while mitigating potential challenges.
Conclusion
- LOD expressions empower users to analyze data at specific levels of detail, enhancing precision and context in calculations.
- They tackle intricate challenges like data blending, cross-database comparisons, and multi-dimensional filtering with ease.
- LOD expressions enrich visualizations by incorporating granular calculations, adding depth to the understanding of data.
- While powerful, LOD expressions can impact performance, demanding optimization for efficiency.
- Proficiency requires grasping data structures, aggregation, and syntax, rewarding with advanced analytical capabilities.
- LOD expressions interact with filters and user interactions, necessitating careful consideration for accurate results.
- Best practices, testing, and continuous improvement ensure LOD expressions unlock Tableau's analytical potential.