Download
1 / 29
350 likes | 879 Views
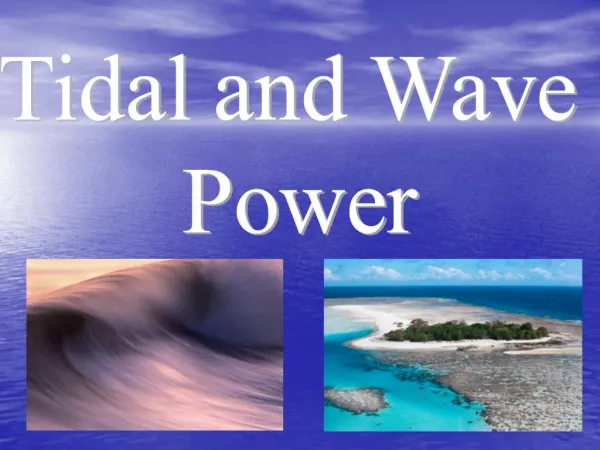
Wave and Tidal Energy. Justin Pyron Amman Bhasin. Wave Basic Facts. Harnesses energy from up and down movement of waves Devices Oscillating water columns Tapchans Pendulor devices Pelamis machine Salter Duck Wave Buoy. Water Column. http://www.youtube.com/watch?v= gcStpg3i5V8

E N D
Wave and Tidal Energy Justin Pyron Amman Bhasin
Wave Basic Facts • Harnesses energy from up and down movement of waves Devices • Oscillating water columns • Tapchans • Pendulor devices • Pelamis machine • Salter Duck • Wave Buoy
Water Column http://www.youtube.com/watch?v=gcStpg3i5V8 (0:48-2:00) https://wiki.uiowa.edu/display/greenergy/Oscillating+Water+Column
Tapchan http://www.youtube.com/watch?v=ETl5OFZQ72s http://www.see.murdoch.edu.au/resources/info/Tech/wave/
Pendulor Device http://www.youtube.com/watch?v=scxg6rbovy0 http://link.springer.com/chapter/10.1007%2F978-3-642-01150-4_9/fulltext.html
Palamis http://www.youtube.com/watch?v=a1qIkdYqoz4#t=63 (1:00-1:30) http://www.pelamiswave.com/image-library
Salter Duck http://www.youtube.com/watch?v=_bdeNuRF-yE (3:15-3:30) http://www.textoscientificos.com/energia/dispositivos-generacion-energia-olas
Wave buoy http://www.youtube.com/watch?v=EsRzTl6Q24E (1:45-2:05) http://tradeunafraid.com/portfolio/the-power-of-waves/
Advantages Disadvantages • Perpetual, will never run out • Majority of world population lives near coasts • Very predictable • Almost every country has access to oceans • Could disturb ocean environments (very minor) • Could disturb regular maritime navigation • Would require greater ocean security (coast guard/navy) • High construction costs • Uncompetitive energy market prices
What causes waves? Influence wave size: wind speed duration of wind distance of water being blown by wind • Air flow above water surface • Could be viewed as an indirect form of solar energy http://www.geography.learnontheinternet.co.uk/topics/waves.html
Tidal Basic Facts • Harnesses energy from in and out movement of high and low tides • Kinetic energy of water transferred into electrical energy by spinning turbines • Dams, tidal fences, tidal turbines
Tidal Dam http://www.youtube.com/watch?feature=player_embedded&v=3oYNmVt6Uso#t=83 (1:02-1:23) http://www.scienceinthenews.org.uk/contents/?article=5
Tidal Turbine http://www.youtube.com/watch?v=ZPi9HeDgN58 (0:30-1:30)
Advantages Disadvantages • Perpetual, will never run out • Water has high density; can generate equivalent energy at lower speeds than wind • Tidal patterns are very predictable • Almost every country has access to oceans • Can impede/disturb sea life (very minor) • Could disturb regular maritime navigation • Would require greater ocean security (coast guard/navy) • High constructions costs • Uncompetitive market energy costs
What causes tides? • High Tide: oceans on both sides of the Earth bulge due to gravitation forces of the moon • Low Tide: the gravitational forces are at their weakest • High and Low tides occur at equal distances apart on the globe • 2 high tides and 2 low tides a day because of Earth’s rotation
Overview • Explanation of tidal power: (0:55-2:30) http://www.youtube.com/watch?v=4Iq-h4ShZ8s&list=TLDPyAlnHTVBzmXgNl7U-uELOpCzf41JUk • Wave and Tidal: Scottish wave farm (-3:25) http://www.youtube.com/watch?v=tSBACzRE3Gw
Costs and Competitiveness • Costs between $0.35 and $0.65 per kWh • 1.5 times more than wind, 3 times more than coal • Construction costs vary, but usually several million dollars • Ex. Tidal installation in S. Korea cost $250 million Trade Offs: Off-shore more expensive, but provides more energy On-shore less expensive, but provides less energy
Potential Energy Production • World Energy Council conservatively estimates energy resources to be around 2,000 TWh/year with current technology • Sounds like a lot, but… • U.S. consumes 28,000 TWh/year • 2,000 TWh/year provides only fraction of needed energy
Current Installations in Use • Sihwa Lake, South Korea • 260 MW • Rance Tidal Power Plant • 240 MW • UK has 1.2 MW and 10.5 MW installations • Massachusetts, Phillipines, China, Australia and India all currently developing sizable installations Sihwa Lake
Suitable Areas • North and western coasts of Europe. Ireland, UK, France, Portugal, Norway • Pacific coastline of North and South America • South Africa • Australia and New Zealand
Areas where electricity can be generated at competitive prices Map courtesy of ABP Marine Environmental Research Ltd
Suitability • Anything that requires electricity • Not suitable for transportation • Not as suitable for areas with small electrical grids than for areas with large electrical grids • Not suitable for areas far away from coasts with current energy transportation technology
Viability • Construction costs must come down (underwater cables) • Energy transportation costs must come down • Greater energy storage techniques need to be developed • Invest more in R&D • Ease regulations for wave and tidal projects by the Federal Energy Regulation Commission (FERC), by the Bureau of Ocean Energy Management Regulation and Enforcement (BOEMRE), and by the National Oceanic and Atmospheric Administration (NOAA)
Implementation Plan • Construct wave and tidal projects in areas with highest average power density (and population density) • Locate areas with small tidal ranges, install shore-mounted devices here • Such examples of these areas include: essentially all coastline • Locate areas with high tidal ranges, install tidal facilities in these areas (dams, fences, turbines) • Such examples of these areas include: Coasts of Alaska, Washington, and British Columbia • Stagger developments through time • Build in most productive areas within first 5-10 years (Washington, Oregon, Maine) • Build in less productive areas later, around 10-15 years, when tech. has improved, costs gone down (Gulf coast, southern Atlantic coast) • Optimistic forecast: in 30 years, produce 15% of US total energy • Unoptimistic prediction: in 30 years, produce 4-5% of US total energy
Example: Maine • All of Maine’s non-transportation energy needs could be met by a Palamis installation that measures 45 by 45 miles • 412.5 Trillion BTU/year • This would be ridiculously expensive
Sources • “Renewable Energy Made Easy” by David Draddock • “Ocean Wave Energy Conversion” by Michael McCormick • “Power from Sea Waves” organized by The Institute of Mathematics and its Applications and edited by B. Count • Institute of Electrical and Electronics Engineers Smart Grid website • U.S. Office of Energy Efficiency and Renewable Energy • U.S. Department of Energy • Pelamiswave.com


![[TIDAL WAVE AND OCEAN CURRENT ENERGY PRODUCTION]](https://cdn1.slideserve.com/1590527/tidal-wave-and-ocean-current-energy-production-dt.jpg)