Graphing Mastery: Comprehensive Worksheets for All Types of Graphs!
- PDF
Description
Unlock the power of visual data representation with our "Graphing Mastery" worksheets, designed for a wide range of grades and abilities.
These comprehensive resources cover every major type of graph, providing your students with the skills they need to read, create, and interpret data visually.
From the basics of bar graphs to the intricacies of box-and-whisker plots, these worksheets offer a hands-on approach to understanding different graphing techniques. Here’s what you’ll find:
- Bar Graph Worksheets: Learn to read, create, and interpret bar graphs to understand various data sets.
- Box Plots (Box-and-Whisker Plots): Discover how to create box plots using quartiles, median, and minimum/maximum values. Ideal for grades 6 through 8.
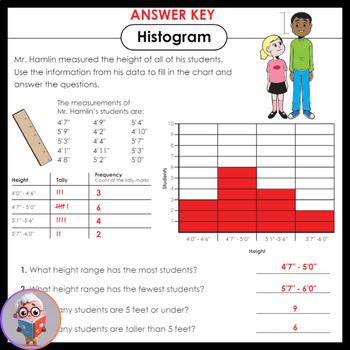
- Histogram Worksheets: Develop skills in reading, interpreting, and creating histograms to represent data distribution.
- Line Graph Worksheets: Master the art of line graphs, learning to plot data trends over time.
- Line Plot (Dot Plot) Worksheets: Understand how to plot frequency on a number line with these interactive exercises.
- Ordered Pair Worksheets: Gain confidence in plotting ordered pairs on coordinate grids, the foundation for more advanced graphing skills.
- Ordered Pair Graph Art (Mystery Graph Pictures): Engage students with fun graph art activities, where they plot points and connect lines to reveal mystery pictures.
- Pictograph Worksheets: Interpret data in a visual format with these picture-symbol graphs.
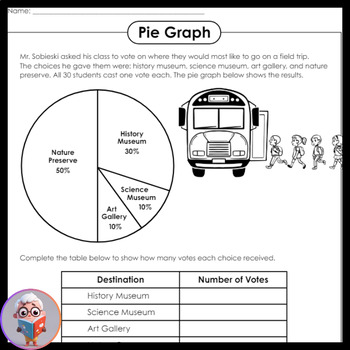
- Pie Graph Worksheets: Analyze circle graphs to understand fractions and percentages in a creative, easy-to-understand format.
Each worksheet is designed to be both educational and enjoyable, encouraging students to explore data in a variety of ways. Whether you're teaching elementary concepts or guiding middle schoolers through more complex graphing, these worksheets offer a comprehensive toolkit for building graphing literacy.
We value your feedback! If you find our "Graphing Mastery" worksheets helpful, please leave a review. Your input helps us improve and create even better resources for teachers and students. Start exploring the world of graphs today!
Keywords: Graphing worksheets, bar graph, box-and-whisker plots, histogram, line graph, line plot, ordered pairs, pictograph, pie graph, education, data interpretation, visualization, feedback.


