Line Plots with Fractions – 5.MD.2 – Bad Dog Breakout for Google Classroom!
Wrestle with Math
1.4k Followers
Wrestle with Math
1.4k Followers

Made for Google Drive™
This resource can be used by students on Google Drive or Google Classroom. To access this resource, you’ll need to allow TPT to add it to your Google Drive. See our FAQ and Privacy Policy for more information.
Also included in
- Grade 5 Math – Bad Dog Breakout Bundle for Google Classroom Are your students ready to help Louie the Pug break out of jail?This bundle includes 23 individual Bad Dog Breakout activities. For each activity, students are first required to complete ten problems aligned to that particular Common CorePrice $35.00Original Price $46.00Save $11.00
Description
Line Plots with Fractions – 5.MD.2 – Bad Dog Breakout for Google Classroom!
Are your students ready to help Louie the Pug break out of jail?
Activity Details:
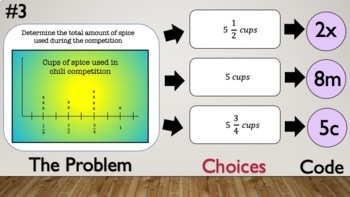
Students are first required to complete ten line-plot with fractions problems. (See preview images) Each correct answer provides a piece of a code that is eventually used to help Louie the Pug break out of jail. The Google breakout form is included with this purchase. Your kids will love this activity especially if there is a prize involved for successfully breaking Louie out!
This activity is aligned to standard 5.MD.2
"The mission of Wrestle with Math is to create engaging, highly effective resources for the math classroom"
Total Pages
Answer Key
N/A
Teaching Duration
N/A
Report this resource to TPT
Reported resources will be reviewed by our team. Report this resource to let us know if this resource violates TPT’s content guidelines.
Standards
to see state-specific standards (only available in the US).
CCSS5.MD.B.2
Make a line plot to display a data set of measurements in fractions of a unit (1/2, 1/4, 1/8). Use operations on fractions for this grade to solve problems involving information presented in line plots. For example, given different measurements of liquid in identical beakers, find the amount of liquid each beaker would contain if the total amount in all the beakers were redistributed equally.


